Quant Analyzer Report
StrategyTester_Tiger_Pro_EURJPY_20050101-20161231
Source: MT4Report| Symbol | EURJPY | Period | D1 : 03.01.2005 - 30.12.2016 |
|---|---|---|---|
| Initial deposit | 10000.0 | ||
| Parameters | - | ||
Total Profit
9535.4
pips
Profit in money
$ 8636.18
Yrly Avg profit
794.84 pips
Yrly Avg % ret
7.2 %
CAGR
5.32 %
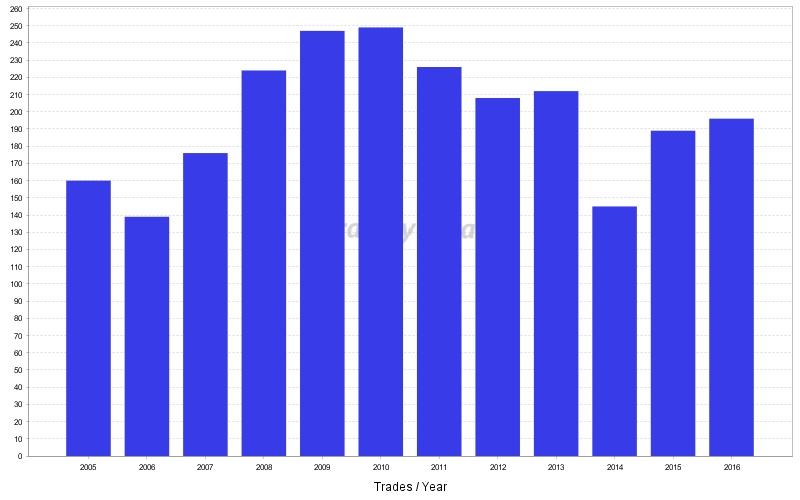
# of trades
2371
Sharpe ratio
0.04
Profit factor
1.09
Return / DD ratio
3.47
Winning %
57.82 %
Drawdown
2747.71 pips
% Drawdown
25.42 %
Daily Avg profit
2.3 pips
Mthly Avg profit
66.22 pips
Average trade
90.68 pips
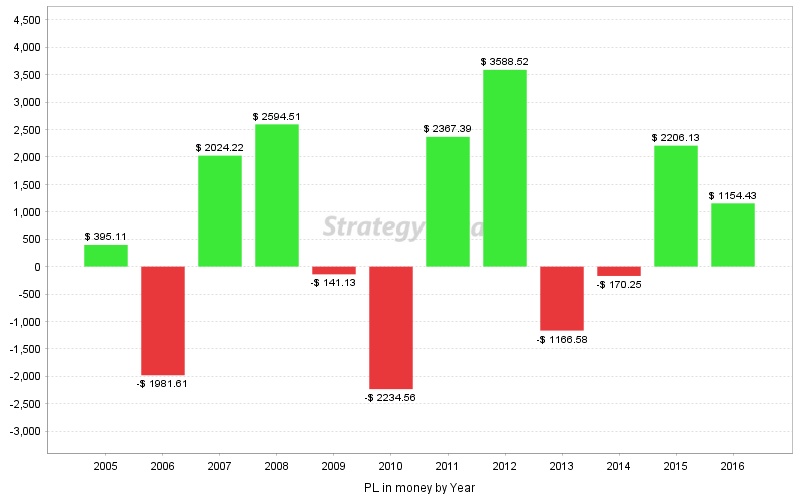
Monthly Performance (pips)
| Year | Jan | Feb | Mar | Apr | May | Jun | Jul | Aug | Sep | Oct | Nov | Dec | YTD |
| 2016 | 490.9 | 707 | -25.8 | 596.2 | -1005.5 | 475.6 | 265.6 | -27.2 | -529.3 | 616.8 | 292.1 | -582 | 1274.4 |
| 2015 | 308.8 | -155 | 801.5 | 433.4 | 212.1 | 879.8 | -255.9 | -448.1 | 235.9 | -227.7 | -68.6 | 720.5 | 2436.7 |
| 2014 | -81.1 | -254.6 | 110.2 | -88.1 | 18.2 | -625.7 | 98.5 | -230.9 | 63.1 | 571 | 689.1 | -457.6 | -187.9 |
| 2013 | -772.2 | -198.2 | 999.3 | -729.3 | -196.9 | -151.7 | -601.1 | -261.3 | -429.9 | -38.5 | 924.4 | 166.7 | -1288.7 |
| 2012 | 678.2 | 1138.8 | -155.4 | 181.4 | 1029.9 | -153 | 3.2 | 65.3 | 480 | 202.8 | 42.4 | 447.6 | 3961.2 |
| 2011 | 244.2 | -349.9 | 415.9 | 948.8 | 14.1 | -499.3 | 553 | -834 | 689.2 | 547.9 | 642.6 | 241.4 | 2613.9 |
| 2010 | -435.7 | -424.7 | 765.4 | -582 | 91.8 | 82.8 | -1130.5 | 376.6 | -406.9 | -326.8 | 142.9 | -618.4 | -2465.5 |
| 2009 | -565.1 | -135.1 | -136.3 | 296 | -291.5 | 341.7 | 230.4 | -220.7 | -201.4 | 590.4 | -252.6 | 188.8 | -155.4 |
| 2008 | 212.1 | 325.2 | -502.6 | 638.2 | -257.1 | 54 | -827 | 122.1 | 903 | 1591.1 | -199.2 | 805.8 | 2865.6 |
| 2007 | 58.5 | 28.7 | -208 | 49.7 | -119.6 | 292.4 | 507.2 | 725 | 419.7 | 637.9 | -395.3 | 238.1 | 2234.3 |
| 2006 | 112 | -212.7 | 57.4 | -610.9 | 62.3 | -378.3 | -552.4 | -112.5 | -253.7 | -124.7 | 14.3 | -189.7 | -2188.9 |
| 2005 | 764 | -323.5 | -456.6 | -186.5 | -21.1 | 126.7 | 611 | 335.6 | -288 | -6.6 | -79 | -40.3 | 435.7 |
Stats
Strategy
| Wins/Losses Ratio | 1.37 | Payout Ratio (Avg Win/Loss) | 0.8 | Average # of Bars in Trade | 0 |
| AHPR | 0.03 | Z-Score | -2.86 | Z-Probability | 99.79 % |
| Expectancy | 4.02 | Deviation | 139.79 pips | Exposure | -999999999 % |
| Stagnation in Days | 889 | Stagnation in % | 20.3 % |
Trades
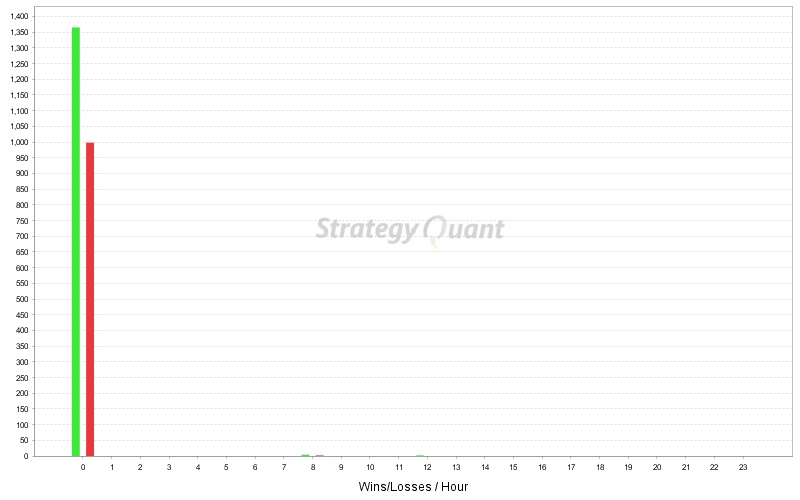
| # of Wins | 1371 | # of Losses | 1000 | # of Cancelled/Expired | 0 | ||
| Gross Profit | 112268.7 pips | Gross Loss | -102733.3 pips | Average Win | 81.89 pips | Average Loss | -102.73 pips |
| Largest Win | 504.3 pips | Largest Loss | -135.1 pips | Max Consec Wins | 13 | Max Consec Losses | 7 |
| Avg Consec Wins | 2.52 | Avg Consec Loss | 1.83 | Avg # of Bars in Wins | 0 | Avg # of Bars in Losses | 0 |
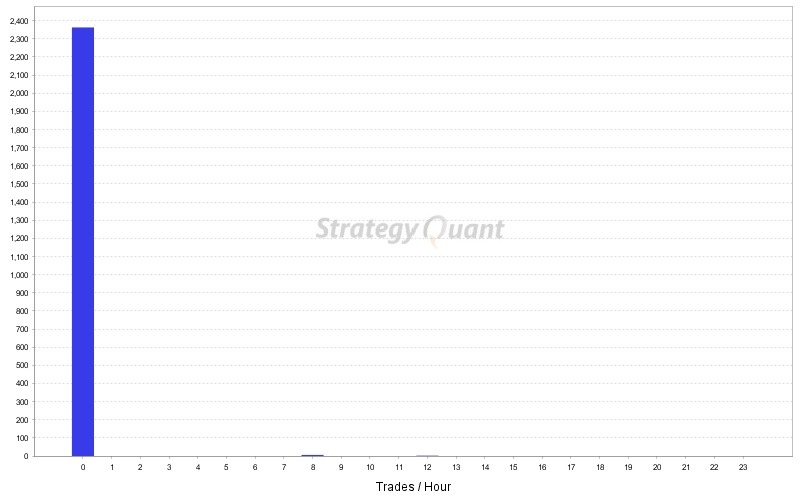
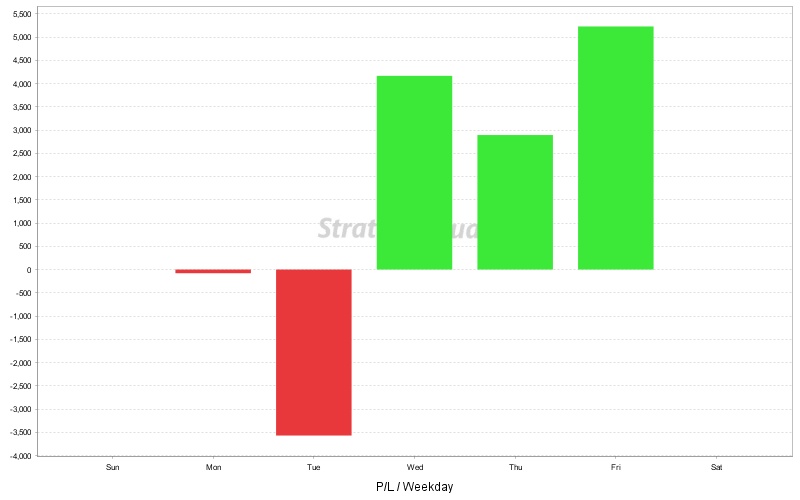
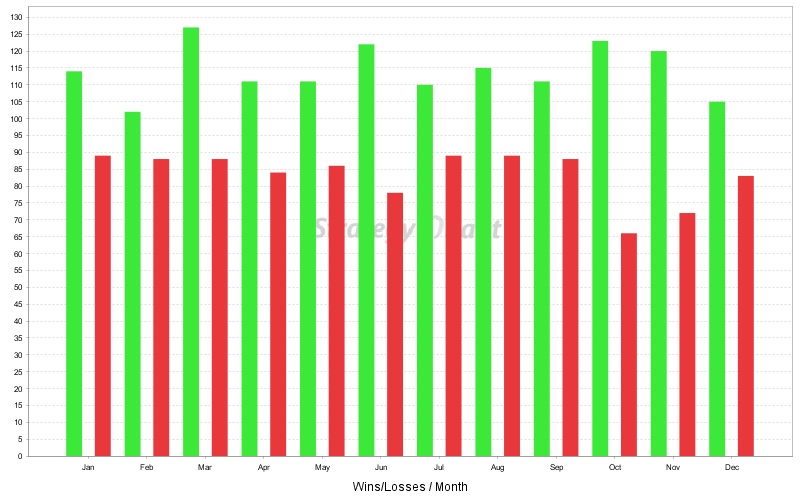
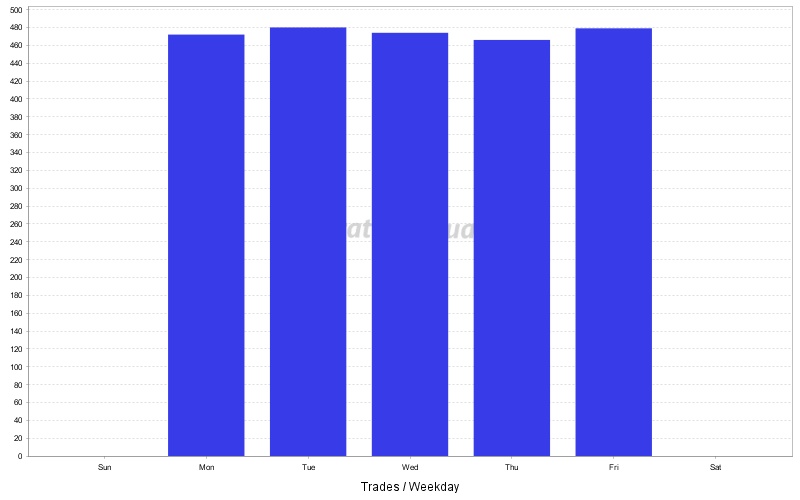
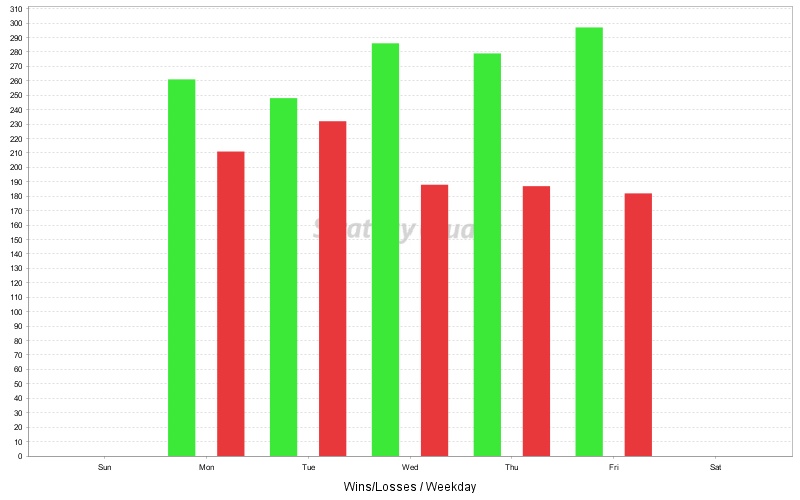
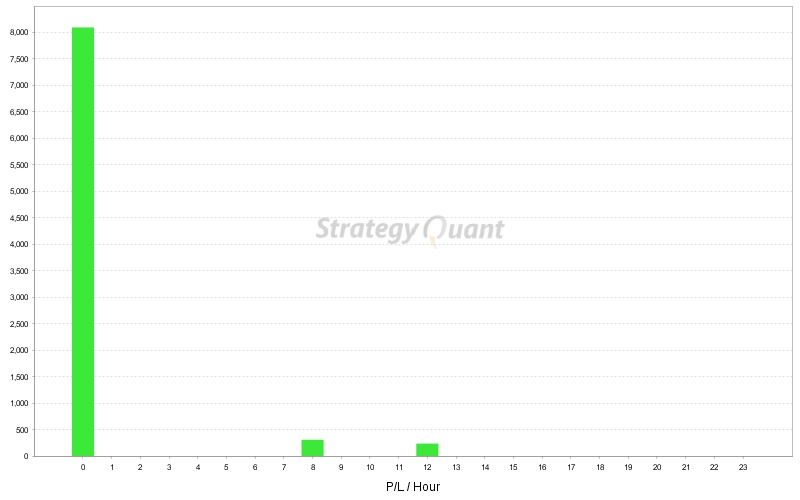
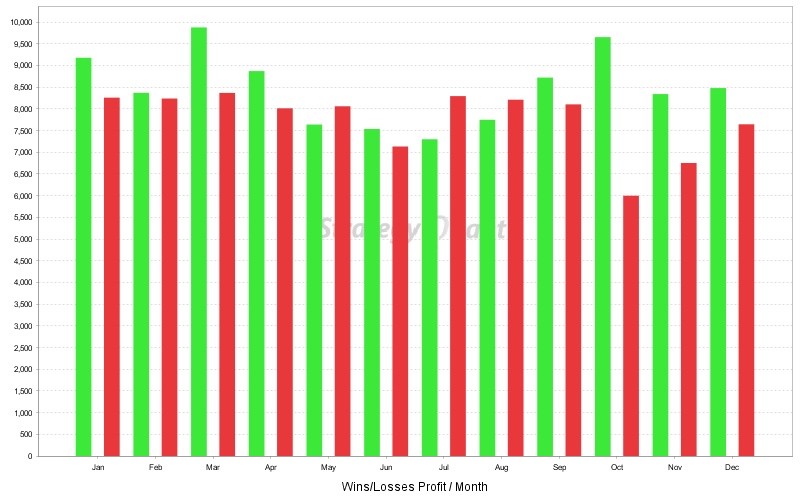
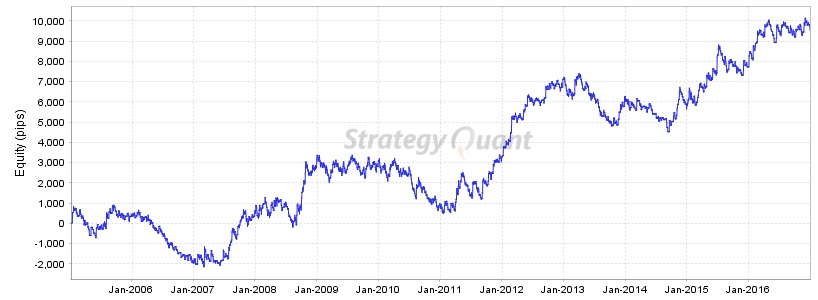
Charts
Click on the chart to see bigger image