Quant Analyzer Report
StrategyTester_Socute_Pro_GBPJPY_20050101-20161231
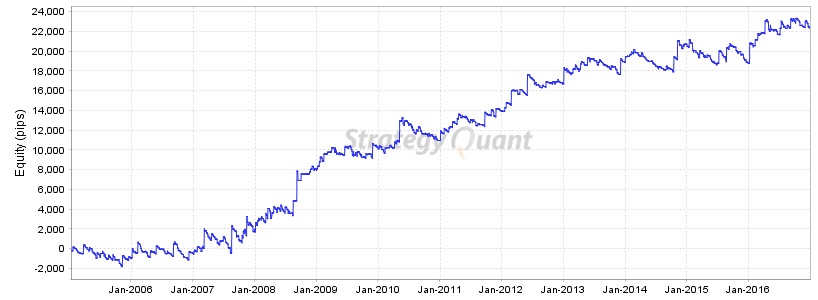
Source: MT4Report| Symbol | GBPJPY | Period | D1 : 06.01.2005 - 30.12.2016 |
|---|---|---|---|
| Initial deposit | 10000.0 | ||
| Parameters | - | ||
Total Profit
22528.2
pips
Profit in money
$ 20402.16
Yrly Avg profit
1876.84 pips
Yrly Avg % ret
17 %
CAGR
9.71 %
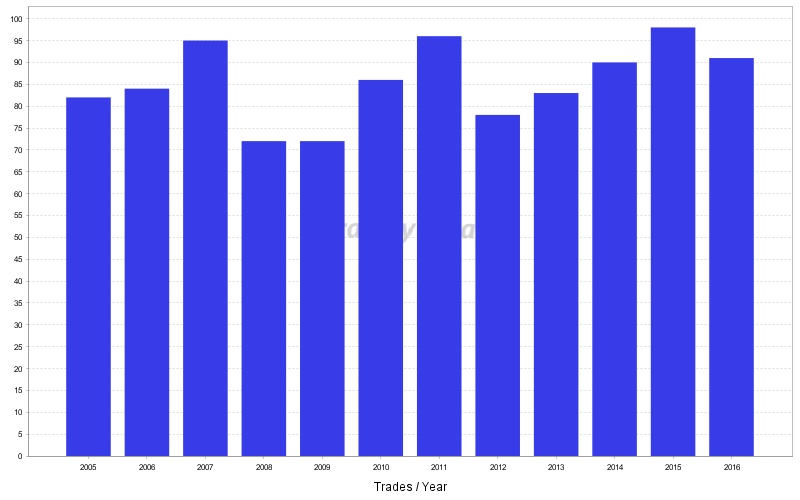
# of trades
1027
Sharpe ratio
0.07
Profit factor
1.29
Return / DD ratio
9.76
Winning %
35.76 %
Drawdown
2307.29 pips
% Drawdown
19.35 %
Daily Avg profit
6.19 pips
Mthly Avg profit
156.45 pips
Average trade
172.65 pips
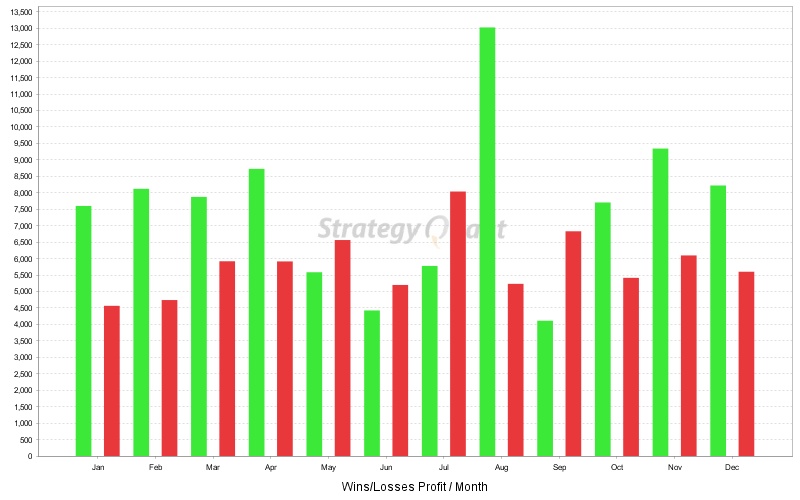
Monthly Performance (pips)
| Year | Jan | Feb | Mar | Apr | May | Jun | Jul | Aug | Sep | Oct | Nov | Dec | YTD |
| 2016 | -250.8 | 1226.4 | 923.7 | 114.1 | -681.6 | -439.2 | 808.2 | 714.9 | -315.9 | -194.4 | 336.7 | -516.2 | 1725.9 |
| 2015 | -1101.3 | -237.9 | -417.8 | -30.3 | -704.8 | 544.2 | -120.5 | 925.2 | 173.1 | -545.8 | 969 | -124.1 | -671 |
| 2014 | 514.3 | -106.8 | 2.3 | -486.1 | -366.3 | -332 | -14.2 | -460.5 | 702.1 | 2233.1 | -551.8 | 893.2 | 2027.3 |
| 2013 | -411.2 | 618.6 | -338.3 | 462.3 | 590.1 | -176.3 | 64 | -500.3 | -238.3 | -426.4 | 1265.8 | 244.5 | 1154.5 |
| 2012 | 564.6 | 1212 | 31.1 | 2074.7 | -492.5 | -421.6 | -557.8 | 68.9 | 173 | -30.1 | 119.8 | 1330.4 | 4072.5 |
| 2011 | 160.4 | 253.8 | 1066.9 | 151.4 | -152.7 | -525.6 | -425.5 | 1563.9 | -353.8 | 397.4 | 185.7 | -25.2 | 2296.7 |
| 2010 | -33.4 | -66.9 | 542.3 | 1145.4 | 771.5 | -27.6 | -898.8 | 566.9 | -650.3 | -60.1 | -403.5 | 710 | 1595.5 |
| 2009 | 1060.5 | 440.1 | 630.8 | -559.4 | -86 | 716.8 | -365.8 | -119 | -570.2 | 340.6 | 1073.1 | -310.3 | 2251.2 |
| 2008 | 651.8 | 265.3 | -511.5 | 1095 | 257.7 | -67.5 | 73.2 | 3423.6 | -273.4 | -5.5 | 486.8 | 36.5 | 5432 |
| 2007 | 667.9 | 1130.5 | -42 | -105.4 | -664.6 | 333.8 | -1022.4 | 2100.9 | -557.5 | 324.5 | 358.7 | 342.6 | 2867 |
| 2006 | 954.6 | -821.3 | 106.2 | -183.9 | 752 | -513.7 | 231.4 | 316.7 | -694 | 235.9 | -397.7 | 121.1 | 107.3 |
| 2005 | 573 | -181.3 | 165.1 | -570.8 | -303.4 | 52.8 | -267.3 | 2.9 | -394.2 | 257.8 | 143.4 | 191.3 | -330.7 |
Stats
Strategy
| Wins/Losses Ratio | 0.56 | Payout Ratio (Avg Win/Loss) | 2.32 | Average # of Bars in Trade | 0 |
| AHPR | 0.12 | Z-Score | -2.93 | Z-Probability | 99.83 % |
| Expectancy | 21.94 | Deviation | 302.79 pips | Exposure | -999999999 % |
| Stagnation in Days | 401 | Stagnation in % | 9.16 % |
Trades
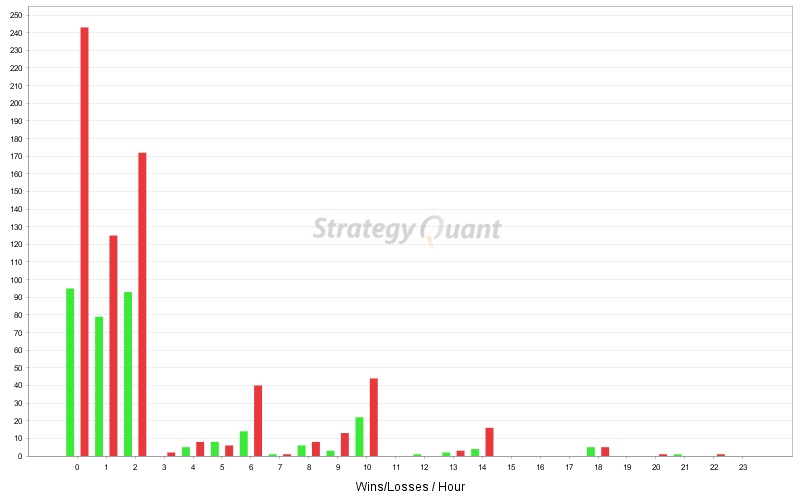
| # of Wins | 339 | # of Losses | 609 | # of Cancelled/Expired | 79 | ||
| Gross Profit | 99917.8 pips | Gross Loss | -77389.6 pips | Average Win | 294.74 pips | Average Loss | -127.08 pips |
| Largest Win | 1628.3 pips | Largest Loss | -795.2 pips | Max Consec Wins | 4 | Max Consec Losses | 21 |
| Avg Consec Wins | 1.68 | Avg Consec Loss | 3.41 | Avg # of Bars in Wins | 0 | Avg # of Bars in Losses | 0 |
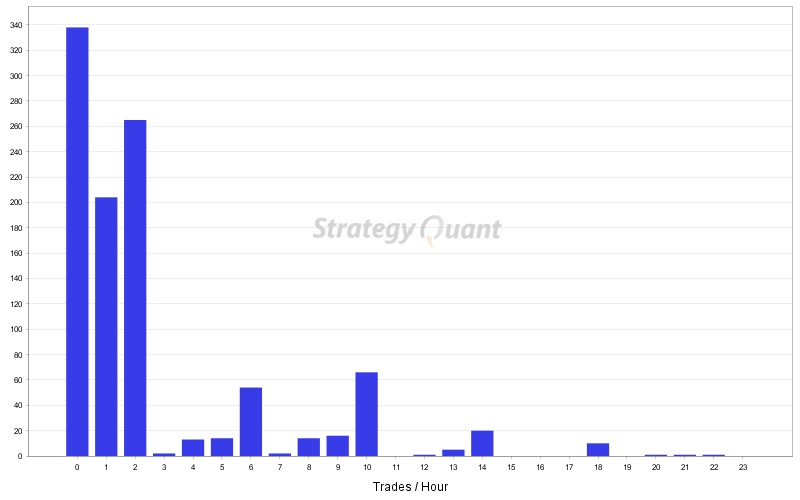
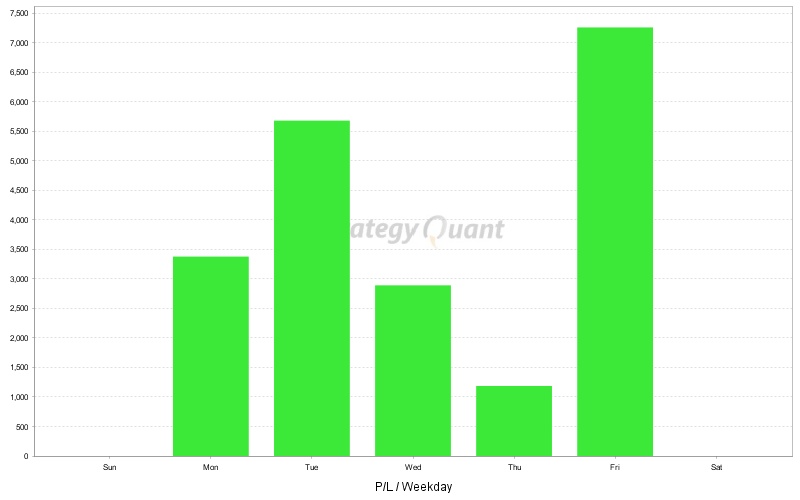
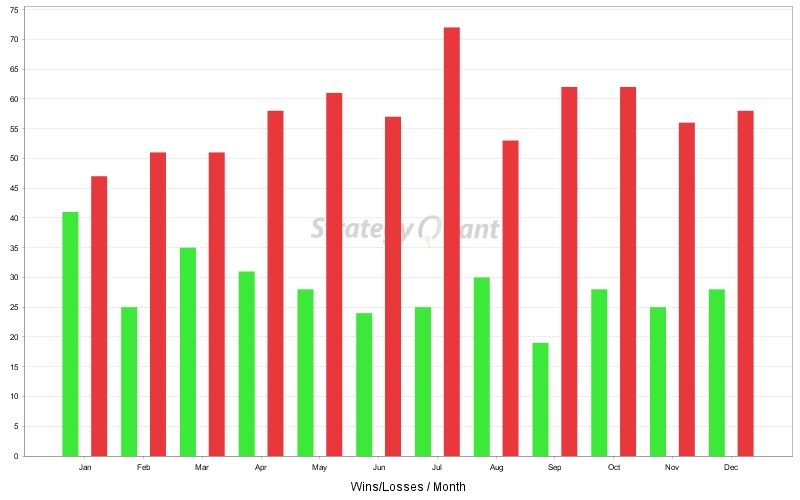
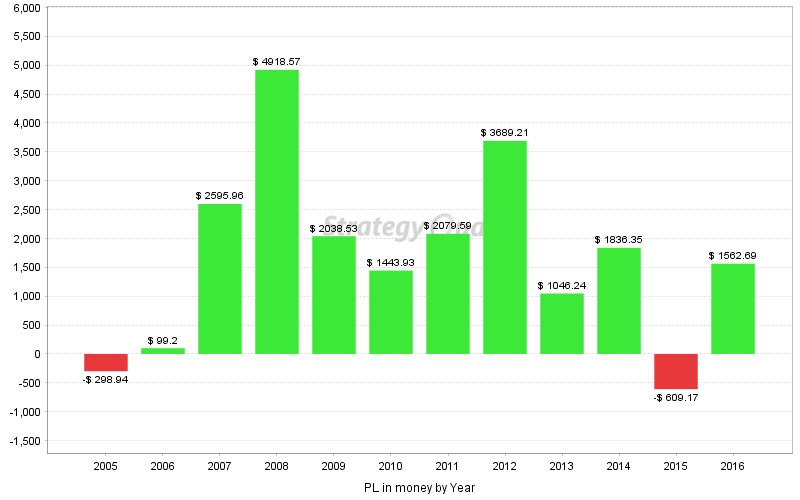
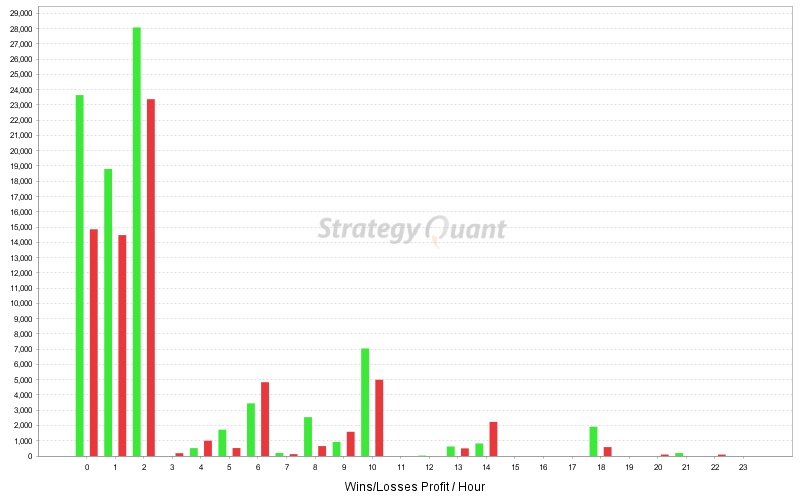
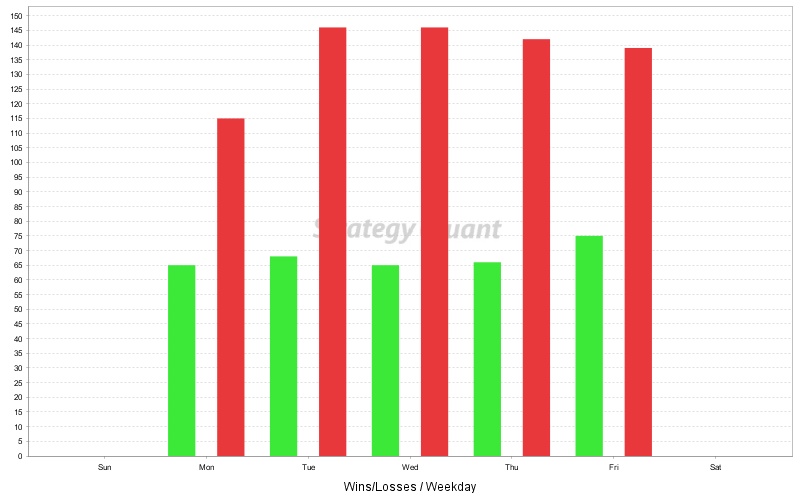
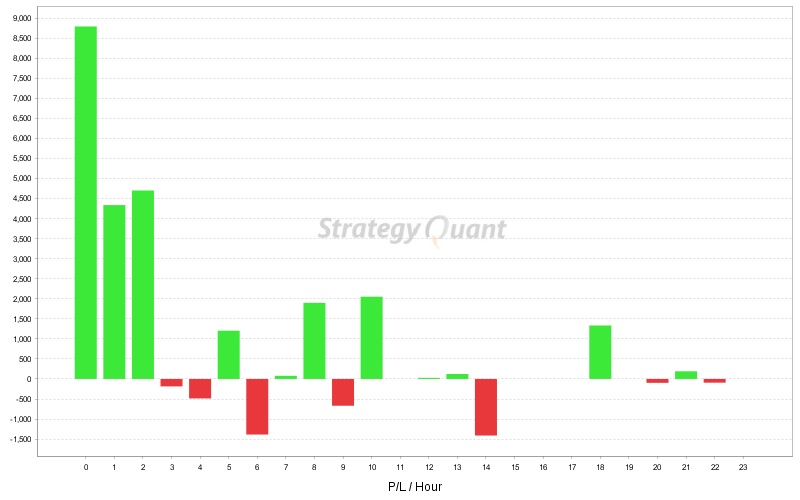
Charts
Click on the chart to see bigger image