Quant Analyzer Report
StrategyTester_Socute_Pro_EURJPY1_20050101-20161231
Source: MT4Report| Symbol | EURJPY | Period | D1 : 05.01.2005 - 30.12.2016 |
|---|---|---|---|
| Initial deposit | 10000.0 | ||
| Parameters | - | ||
Total Profit
14661.9
pips
Profit in money
$ 13279.02
Yrly Avg profit
1222.5 pips
Yrly Avg % ret
11.07 %
CAGR
7.3 %
# of trades
1160
Sharpe ratio
0.08
Profit factor
1.25
Return / DD ratio
8.46
Winning %
40.93 %
Drawdown
1734.02 pips
% Drawdown
12.82 %
Daily Avg profit
4.02 pips
Mthly Avg profit
101.82 pips
Average trade
112.81 pips
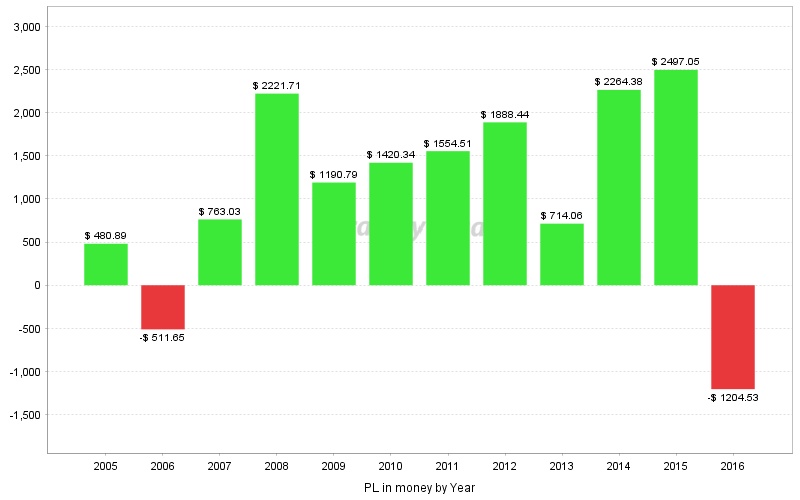
Monthly Performance (pips)
| Year | Jan | Feb | Mar | Apr | May | Jun | Jul | Aug | Sep | Oct | Nov | Dec | YTD |
| 2016 | 127.2 | 368.4 | -326.1 | -44.9 | -625.7 | 11.9 | -254.2 | -11.9 | -296.9 | 174.2 | 66.8 | -518.4 | -1329.6 |
| 2015 | 146 | 498.5 | -188.8 | 703.9 | -157.2 | 237.7 | -174.8 | 500.1 | 251 | 275.4 | -150.5 | 816.5 | 2757.8 |
| 2014 | 27.2 | 173 | -61.4 | -133.9 | -82.6 | -145.2 | -77.1 | 140.4 | 539 | 897.8 | 72.8 | 1150.2 | 2500.2 |
| 2013 | 617.2 | -432.8 | -26.8 | 794 | -421.6 | 420.2 | -249.4 | -93.1 | 8.2 | -100.7 | 228.9 | 43.6 | 787.7 |
| 2012 | -138.7 | 1121.3 | 395.2 | -141.7 | 787.2 | 84.9 | 217.5 | -148.8 | 97.6 | -112.7 | 10.8 | -87.7 | 2084.9 |
| 2011 | 155.9 | -388.9 | 1778.3 | -184.1 | -72 | -349.2 | 183.8 | 325 | -172.6 | -36.4 | -242.8 | 718.9 | 1715.9 |
| 2010 | 140.8 | -335.5 | 346.4 | 1055.8 | 672.4 | -168.7 | -534.9 | 738 | 188.2 | -732.8 | 109.1 | 90.4 | 1569.2 |
| 2009 | 48.6 | 130.1 | 106.7 | 684.9 | -372.5 | -212.4 | -270.4 | 22.6 | 653.9 | -18.1 | 168.5 | 372.7 | 1314.6 |
| 2008 | 5.5 | 680.4 | -285.1 | 300.3 | -235.3 | 304.4 | -287.7 | 1384.1 | 393.3 | 135.1 | -174.9 | 233.6 | 2453.7 |
| 2007 | 483.9 | -97.1 | 338.1 | 225.3 | -460.8 | 151.6 | 225.8 | 782.8 | 483.7 | -126 | -979.5 | -185.3 | 842.5 |
| 2006 | -25.4 | 66.4 | -14.6 | 171.2 | -284 | -222.8 | -182.1 | 174.9 | 81.1 | -104 | -211.8 | -14.5 | -565.6 |
| 2005 | 128.5 | 108.5 | -214 | 77.8 | 218.6 | -514.1 | 388.8 | 376.1 | -330.9 | -146.6 | 409.1 | 28.8 | 530.6 |
Stats
Strategy
| Wins/Losses Ratio | 0.69 | Payout Ratio (Avg Win/Loss) | 1.81 | Average # of Bars in Trade | 0 |
| AHPR | 0.08 | Z-Score | -0.37 | Z-Probability | 64.43 % |
| Expectancy | 12.64 | Deviation | 191.74 pips | Exposure | -999999999 % |
| Stagnation in Days | 399 | Stagnation in % | 9.11 % |
Trades
| # of Wins | 458 | # of Losses | 661 | # of Cancelled/Expired | 41 | ||
| Gross Profit | 72760.2 pips | Gross Loss | -58098.3 pips | Average Win | 158.87 pips | Average Loss | -87.89 pips |
| Largest Win | 1273.4 pips | Largest Loss | -696.8 pips | Max Consec Wins | 7 | Max Consec Losses | 16 |
| Avg Consec Wins | 1.72 | Avg Consec Loss | 2.63 | Avg # of Bars in Wins | 0 | Avg # of Bars in Losses | 0 |
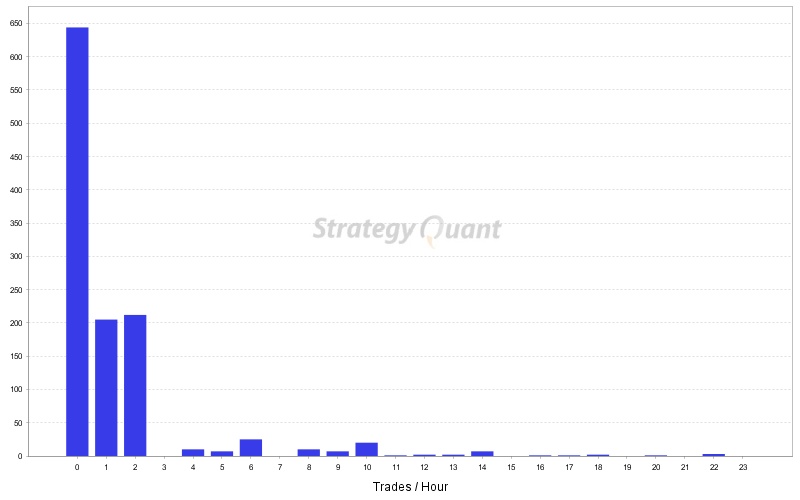
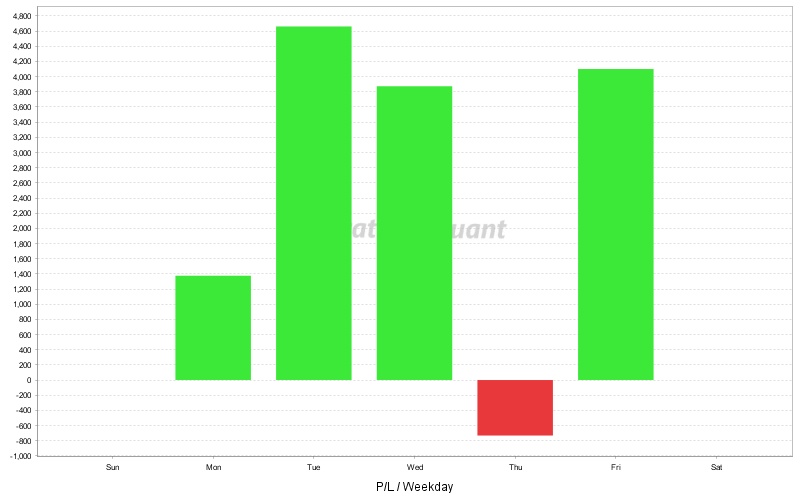
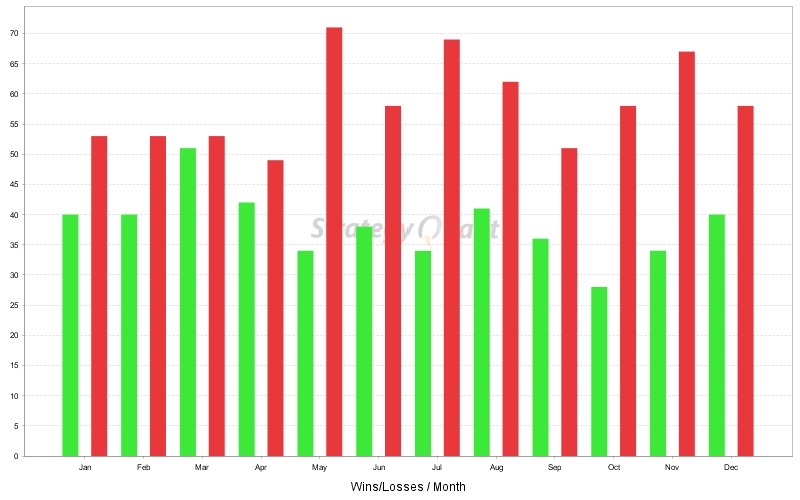
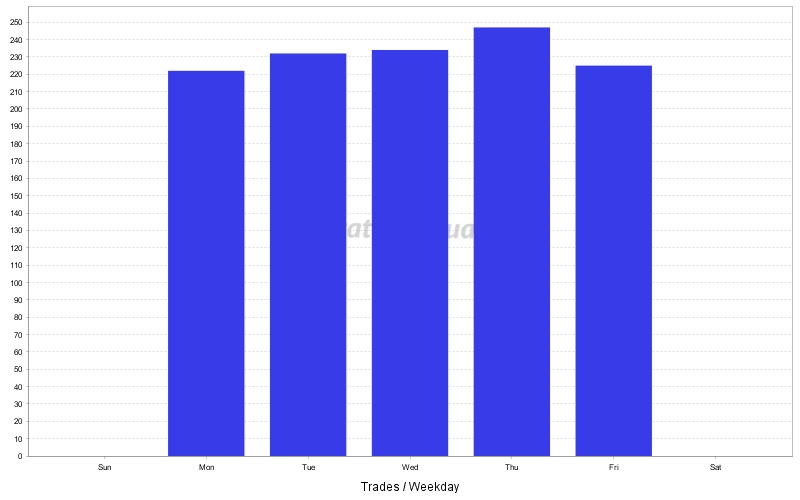
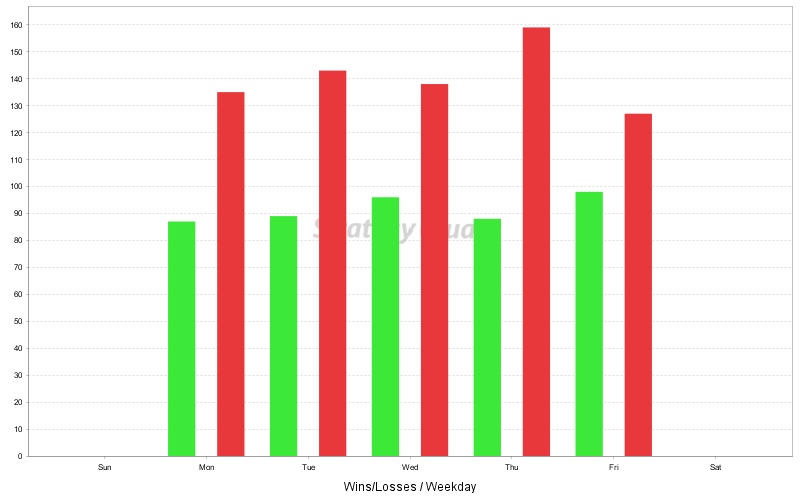
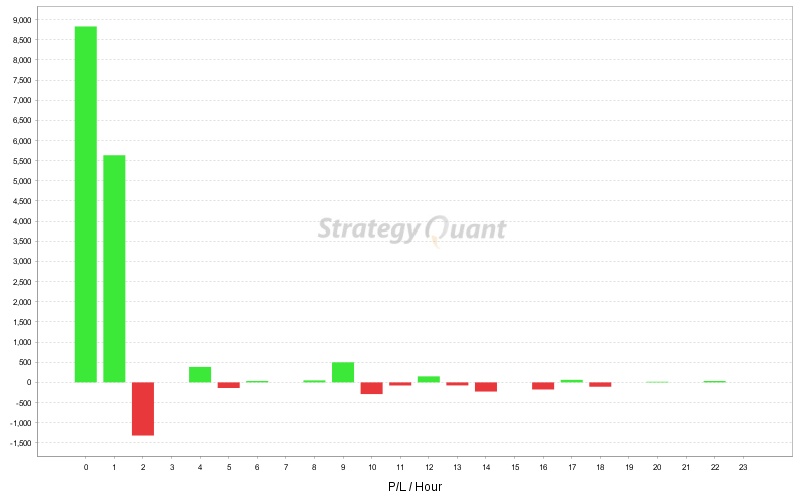
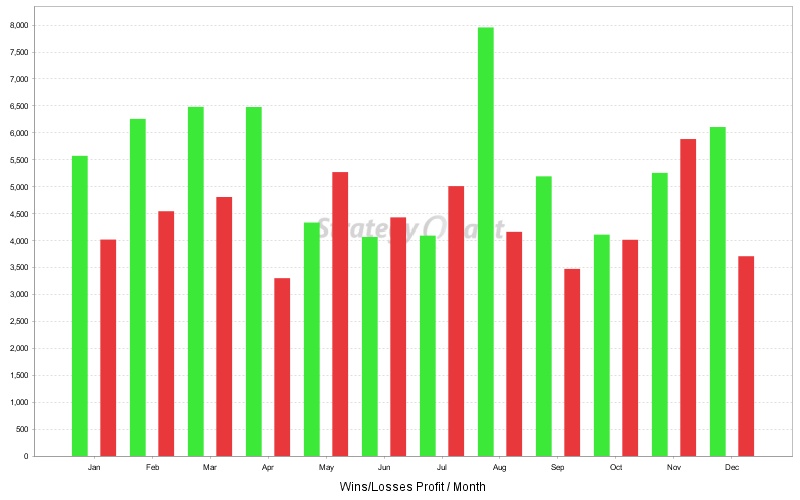
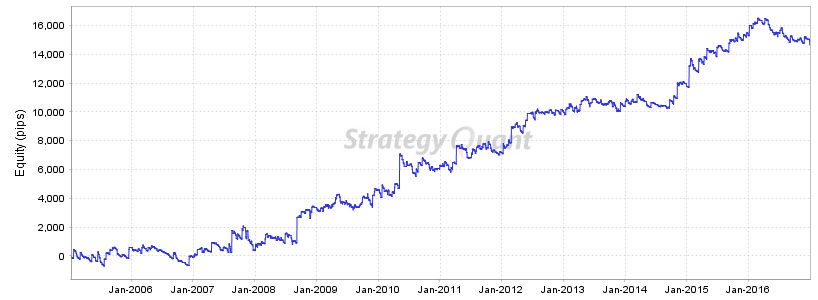
Charts
Click on the chart to see bigger image