Quant Analyzer Report
StrategyTester_Ichiro_Pro_USDJPY2_20050101-20161231
Source: MT4Report| Symbol | USDJPY | Period | H4 : 03.01.2005 - 30.12.2016 |
|---|---|---|---|
| Initial deposit | 10000.0 | ||
| Parameters | - | ||
Total Profit
11102
pips
Profit in money
$ 10327.7
Yrly Avg profit
925.21 pips
Yrly Avg % ret
8.61 %
CAGR
6.09 %
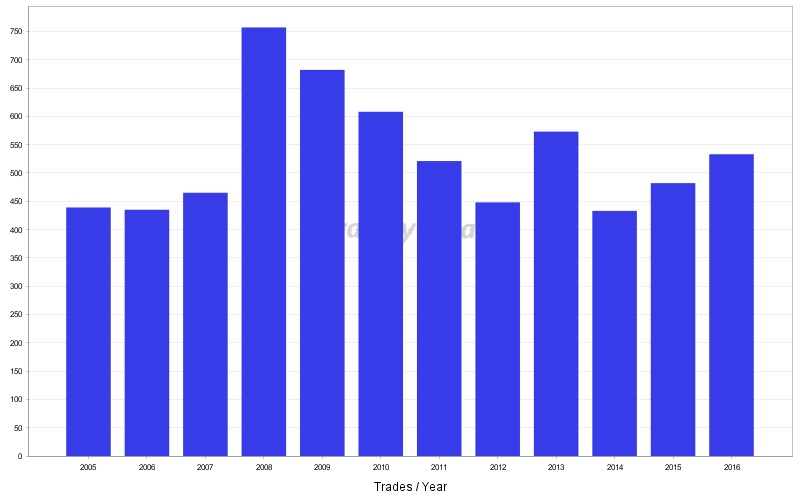
# of trades
6376
Sharpe ratio
0.02
Profit factor
1.09
Return / DD ratio
2.85
Winning %
42.35 %
Drawdown
3897.4 pips
% Drawdown
22.43 %
Daily Avg profit
2.54 pips
Mthly Avg profit
77.1 pips
Average trade
41.04 pips

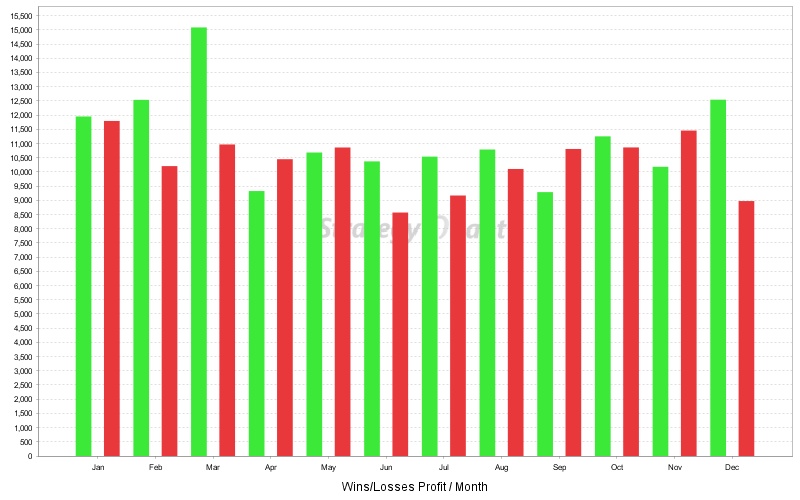
Monthly Performance (pips)
| Year | Jan | Feb | Mar | Apr | May | Jun | Jul | Aug | Sep | Oct | Nov | Dec | YTD |
| 2016 | -322.5 | 1133.4 | 373.1 | 359 | 508.5 | -77.7 | 308 | 571.7 | -410.1 | -245.8 | 700.2 | 257.3 | 3155.1 |
| 2015 | -647.7 | -67.5 | -193.4 | -282.2 | 370.1 | 5.4 | 73 | 1127.9 | -773.2 | -100.5 | -56.8 | 158 | -386.9 |
| 2014 | 181.9 | -535.8 | 324.7 | 287.8 | -197.2 | 24.2 | 133.7 | 272.5 | -205.9 | 731.3 | -47.1 | 1073.9 | 2044 |
| 2013 | 984.8 | 105.2 | 233.9 | 507 | -308.1 | 405.3 | -42.2 | 326.3 | -337.9 | -79 | -228.5 | 0.8 | 1567.6 |
| 2012 | 677 | 62.1 | 38 | -802 | 174.1 | 5.5 | -109.9 | -54.2 | 168.9 | -211.6 | 275.3 | 218.1 | 441.3 |
| 2011 | -139.8 | 64.6 | 953.7 | -213.6 | -382.4 | -247.2 | -69.7 | -512.2 | -594.4 | 170.9 | -143 | -7.2 | -1120.3 |
| 2010 | 43.2 | -50.5 | -2.8 | 52.1 | 140 | 247.1 | -335.5 | -437.3 | -88.9 | -127.6 | -317.4 | -21.5 | -899.1 |
| 2009 | 19.9 | 344.3 | 1530.4 | 107.6 | 39.7 | -57.2 | 571.6 | -242.3 | 310 | 378.1 | -106.8 | 495.4 | 3390.7 |
| 2008 | -757.5 | 587.1 | 438.3 | -300.3 | -4.4 | -15.8 | 130.2 | -41.9 | -207.3 | 59.5 | -594.5 | 430.5 | -276.1 |
| 2007 | -74.9 | 1020.9 | -266.2 | -246.3 | -248 | 159.2 | 91.7 | 190.7 | 358.2 | 28.6 | -319.3 | 1031.1 | 1725.7 |
| 2006 | -91.9 | -308.5 | 28.9 | 134.9 | -111.2 | 759.9 | 316.4 | -407.5 | 203.3 | 206.9 | -206.3 | -118.4 | 406.5 |
| 2005 | -174.6 | 222.9 | 272.6 | -615.4 | -144.9 | 818 | 495.5 | 330 | 93 | -322.4 | -179.9 | 258.7 | 1053.5 |
Stats
Strategy
| Wins/Losses Ratio | 0.73 | Payout Ratio (Avg Win/Loss) | 1.48 | Average # of Bars in Trade | 0 |
| AHPR | 0.01 | Z-Score | -15.19 | Z-Probability | 99.9 % |
| Expectancy | 1.74 | Deviation | 79.41 pips | Exposure | -999999999 % |
| Stagnation in Days | 1631 | Stagnation in % | 37.24 % |
Trades
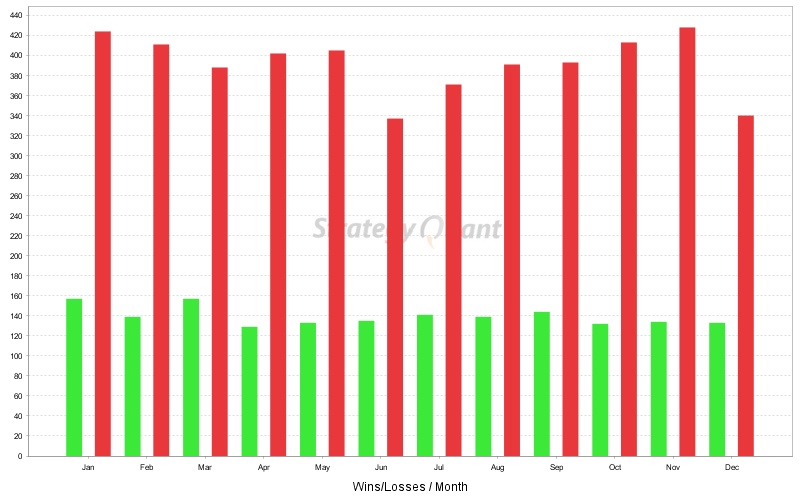
| # of Wins | 1673 | # of Losses | 2277 | # of Cancelled/Expired | 2426 | ||
| Gross Profit | 136400.6 pips | Gross Loss | -125298.6 pips | Average Win | 81.53 pips | Average Loss | -55.03 pips |
| Largest Win | 777.1 pips | Largest Loss | -68.2 pips | Max Consec Wins | 6 | Max Consec Losses | 24 |
| Avg Consec Wins | 1.86 | Avg Consec Loss | 5.23 | Avg # of Bars in Wins | 0 | Avg # of Bars in Losses | 0 |
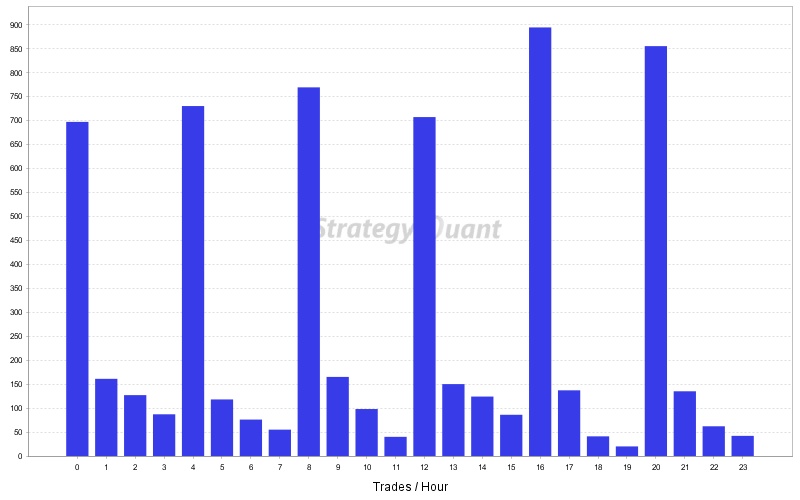
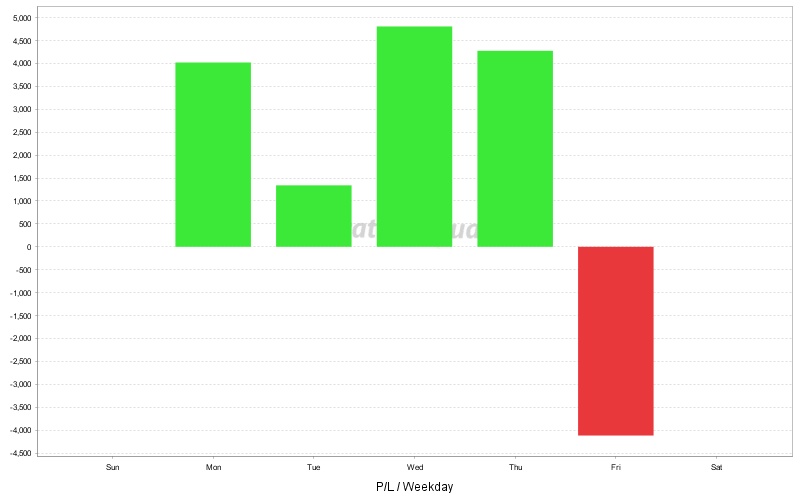
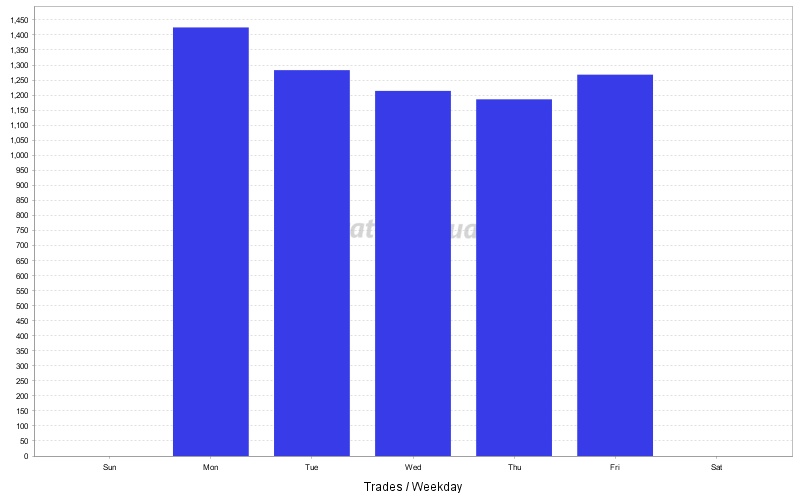
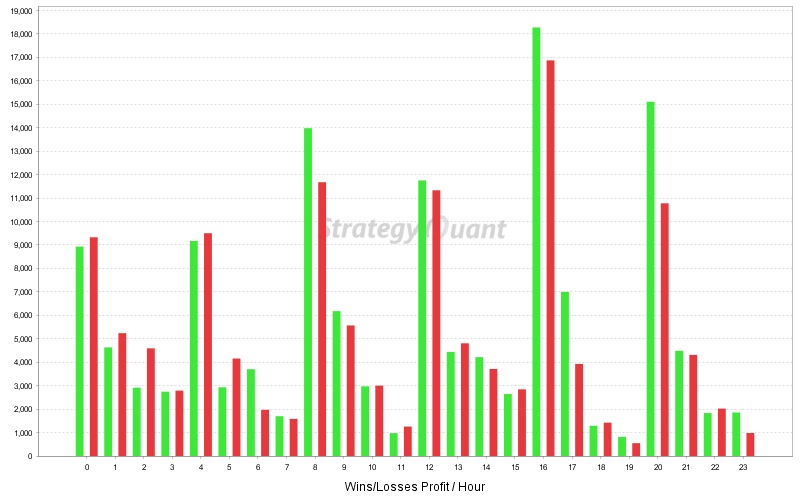
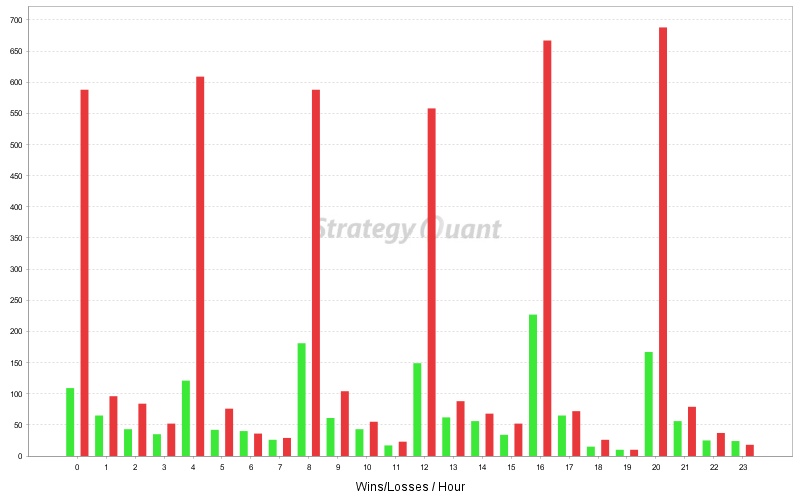
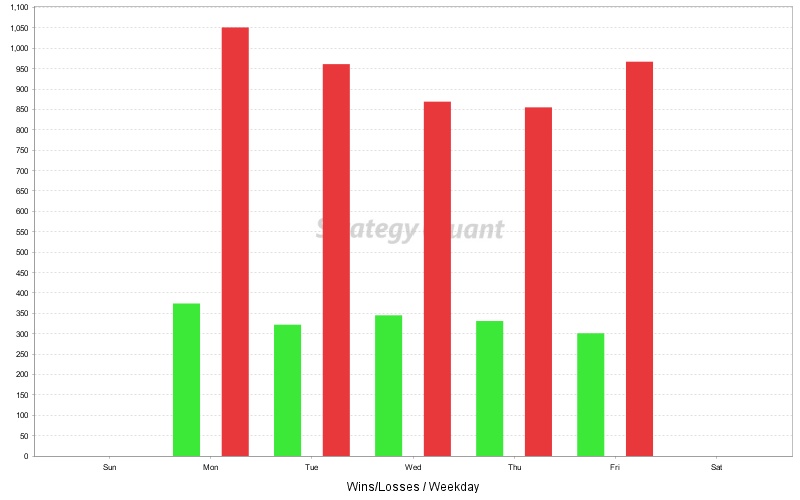
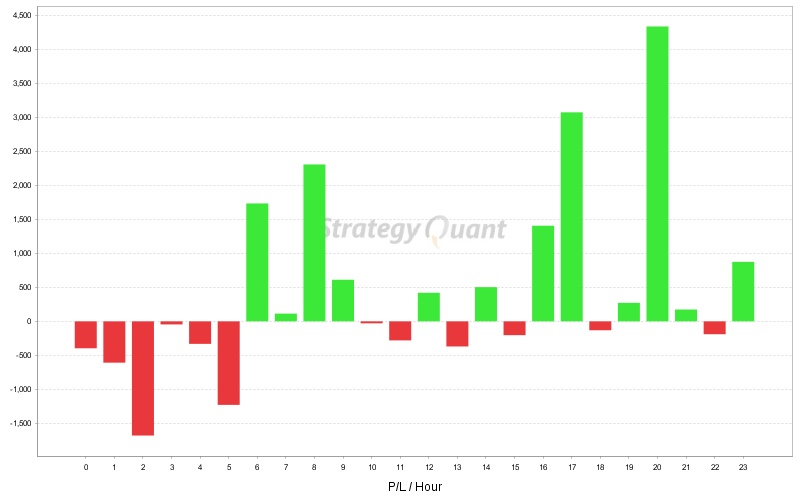
Charts
Click on the chart to see bigger image