Quant Analyzer Report
StrategyTester_Ichiro_Pro_GBPJPY3_20050101-20161231
Source: MT4Report| Symbol | GBPJPY | Period | H4 : 03.01.2005 - 30.12.2016 |
|---|---|---|---|
| Initial deposit | 10000.0 | ||
| Parameters | - | ||
Total Profit
34915.1
pips
Profit in money
$ 31625.89
Yrly Avg profit
2909.11 pips
Yrly Avg % ret
26.35 %
CAGR
12.62 %
# of trades
4073
Sharpe ratio
0.05
Profit factor
1.13
Return / DD ratio
8.11
Winning %
47.41 %
Drawdown
4306.67 pips
% Drawdown
23.45 %
Daily Avg profit
7.98 pips
Mthly Avg profit
242.47 pips
Average trade
143.23 pips
Monthly Performance (pips)
| Year | Jan | Feb | Mar | Apr | May | Jun | Jul | Aug | Sep | Oct | Nov | Dec | YTD |
| 2016 | -1508.4 | 1894.8 | 247.6 | 1411.2 | 1453.8 | 1716 | -36.1 | -114.9 | -1689.5 | -271.3 | 1182.5 | -427.1 | 3858.6 |
| 2015 | 184.9 | -997.4 | -1369.8 | 201.1 | 416 | -8.3 | 459.8 | 787.5 | 387.5 | -647.9 | -385.4 | 939.4 | -32.6 |
| 2014 | 1517.6 | -1331.3 | 446.6 | -716.1 | 285 | -343.2 | -180.3 | -610.6 | 1752.6 | 1747 | 90.1 | -112.8 | 2544.6 |
| 2013 | 1052.3 | 55.1 | -380.7 | 2825.4 | 232 | -509.6 | -175.6 | 483.1 | 4.9 | -27.9 | 701.6 | 585.6 | 4846.2 |
| 2012 | 973 | 139.2 | 835.5 | 48.1 | 790.2 | -338.2 | 295.6 | -94.1 | 141.7 | -163.8 | -164.4 | 492.8 | 2955.6 |
| 2011 | 182.9 | -829.6 | 1344.6 | 410.5 | -493.5 | -86.8 | 164.6 | -272.4 | -443.2 | -387.7 | -429.9 | -161.9 | -1002.4 |
| 2010 | -500.7 | 1093.9 | 1557.9 | 247.5 | -148.5 | -1103.9 | -158.6 | -14.2 | 301 | -475.7 | -762.9 | 60.8 | 96.6 |
| 2009 | 1315.5 | 1116.2 | 3054.1 | 1332.8 | -2205.1 | -1438.9 | 2160.9 | -331.5 | 947.8 | 626 | -913.1 | 1208.7 | 6873.4 |
| 2008 | -299.1 | 534.6 | -791.1 | 348.5 | 562.5 | -1295.7 | 121.3 | 1193.3 | -1119.8 | 3589.9 | 872 | -2098.3 | 1618.1 |
| 2007 | 1066.9 | 3147 | 1714.1 | -1067.2 | -297.9 | 436.5 | 862.4 | 2776.7 | 546.3 | -645.3 | -214.9 | 2913.3 | 11237.9 |
| 2006 | 122.5 | 1614.4 | -353.3 | 389.5 | -416.3 | 181.9 | 313.9 | 310.4 | -48.7 | -694.5 | 310.9 | 480.4 | 2211.1 |
| 2005 | -570.7 | -148 | -134.6 | -34.4 | -496.8 | 381.9 | -179.7 | -46.5 | -802.9 | -125.4 | 1017.3 | 847.8 | -292 |
Stats
Strategy
| Wins/Losses Ratio | 0.9 | Payout Ratio (Avg Win/Loss) | 1.25 | Average # of Bars in Trade | 0 |
| AHPR | 0.04 | Z-Score | -13.62 | Z-Probability | 99.9 % |
| Expectancy | 8.57 | Deviation | 227.85 pips | Exposure | -999999999 % |
| Stagnation in Days | 1063 | Stagnation in % | 24.27 % |
Trades
| # of Wins | 1931 | # of Losses | 2142 | # of Cancelled/Expired | 0 | ||
| Gross Profit | 309149.7 pips | Gross Loss | -274234.6 pips | Average Win | 160.1 pips | Average Loss | -128.03 pips |
| Largest Win | 1150.8 pips | Largest Loss | -199.7 pips | Max Consec Wins | 14 | Max Consec Losses | 12 |
| Avg Consec Wins | 2.41 | Avg Consec Loss | 2.68 | Avg # of Bars in Wins | 0 | Avg # of Bars in Losses | 0 |
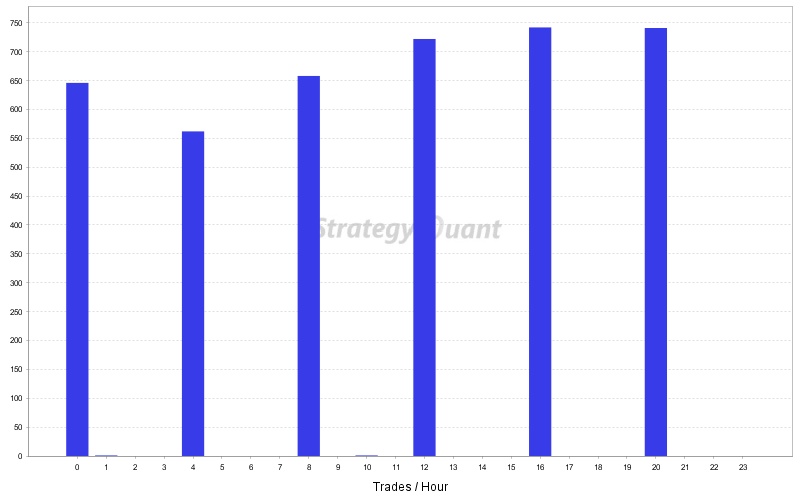
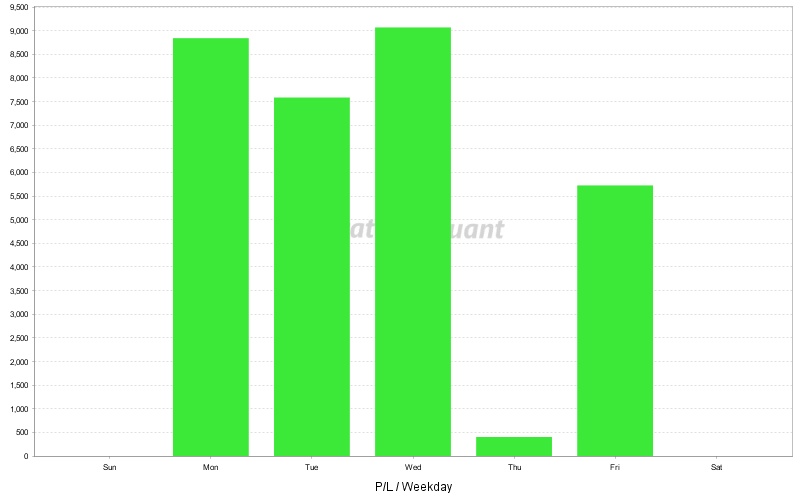
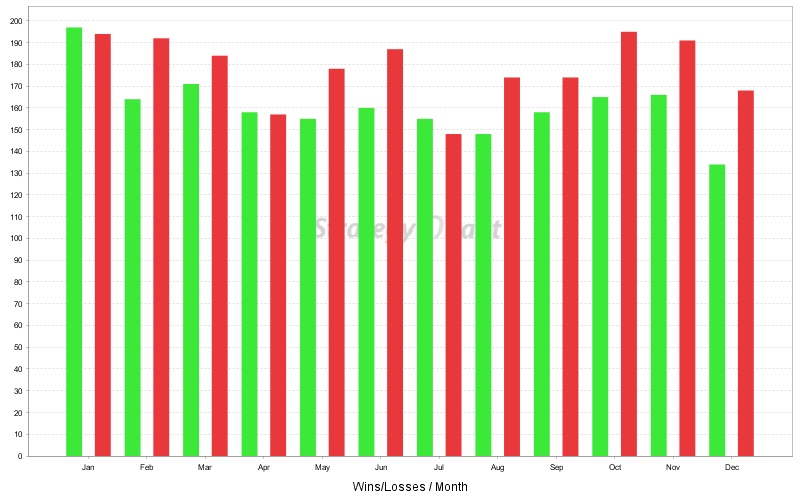
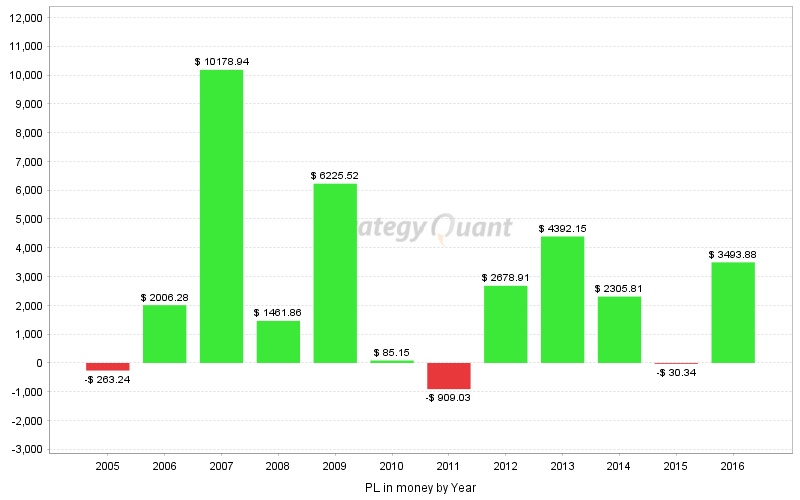
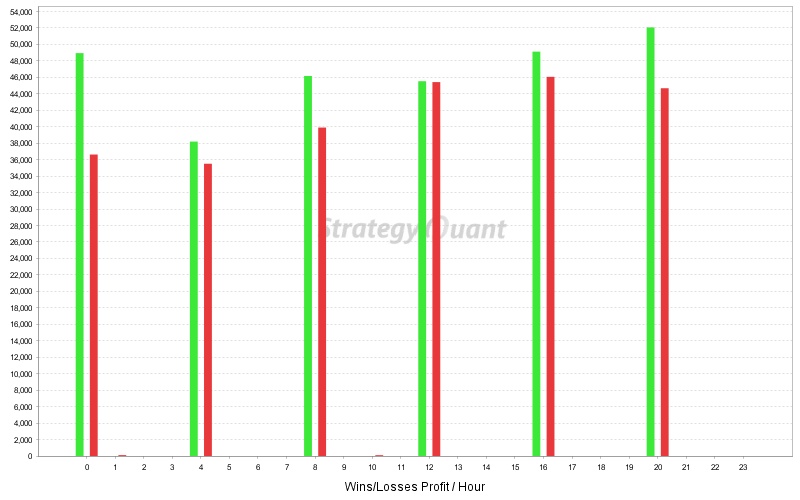
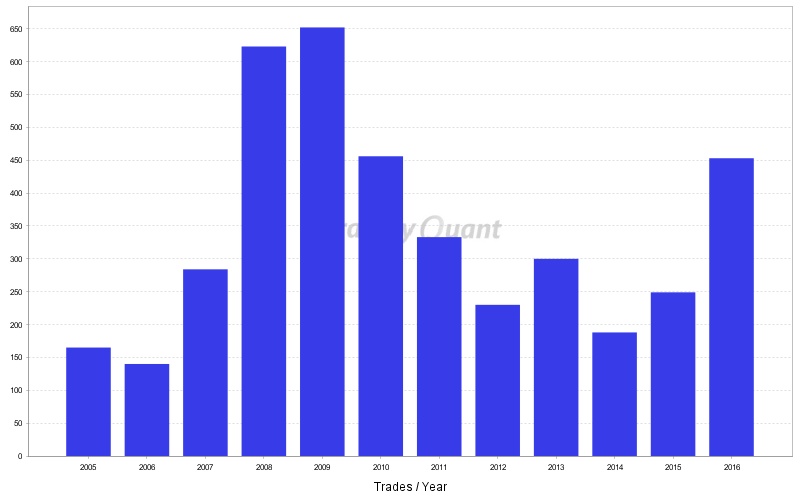
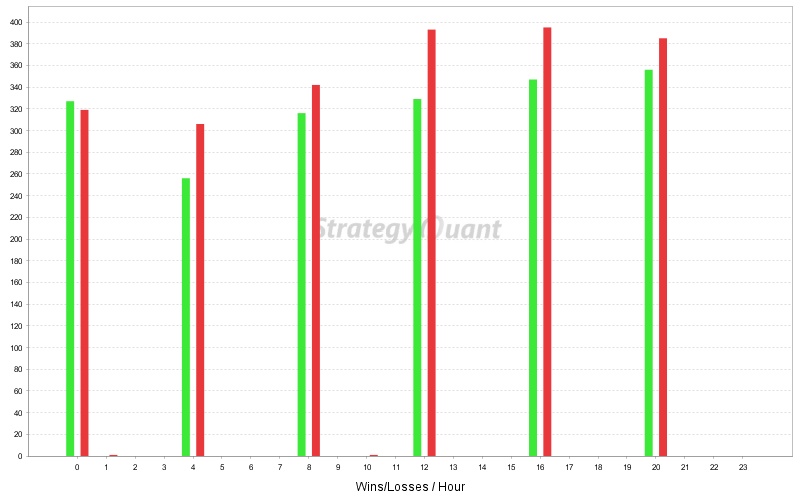
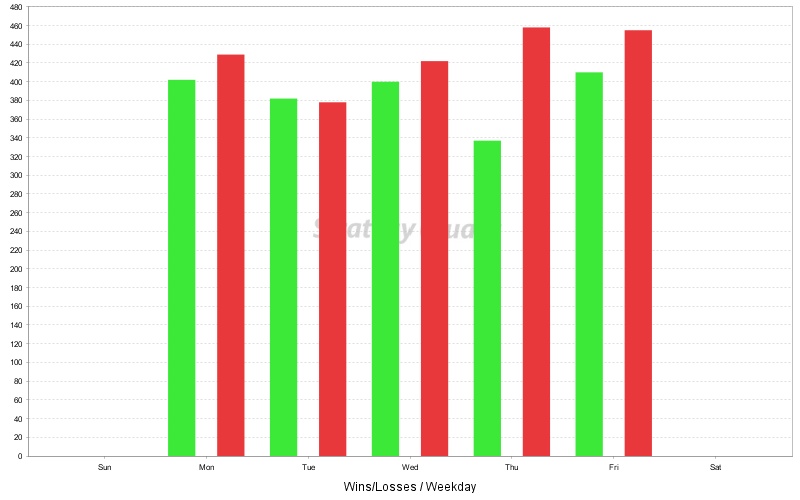
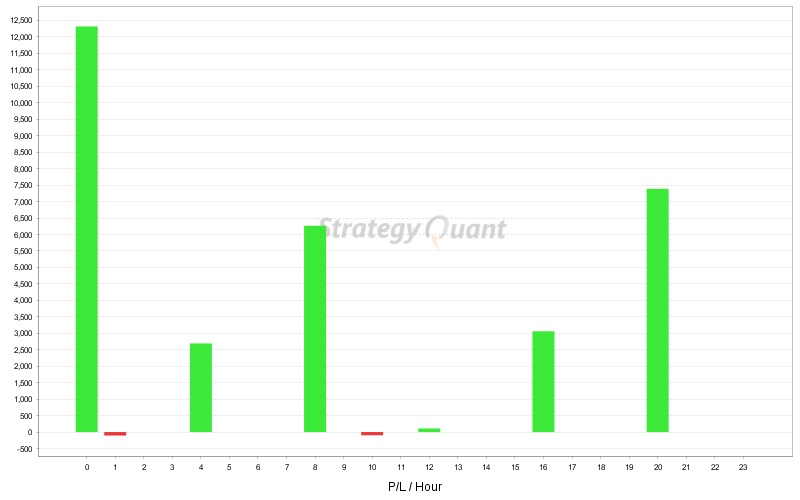
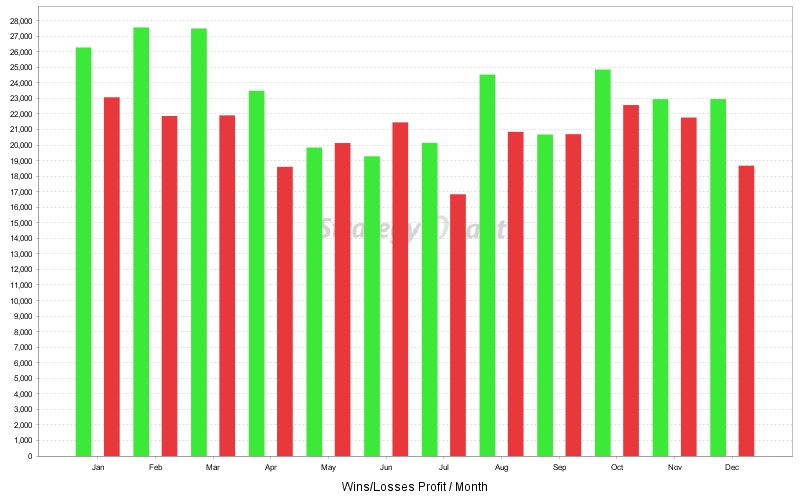
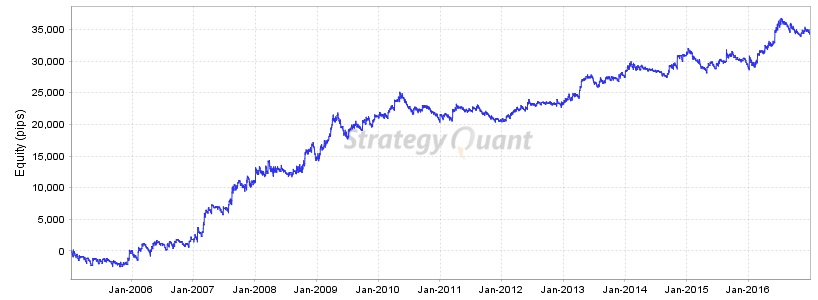
Charts
Click on the chart to see bigger image