Quant Analyzer Report
StrategyTester_Angely_Pro_GBPUSD1_20050101-20161231
Source: MT4Report| Symbol | GBPUSD | Period | D1 : 03.01.2005 - 30.12.2016 |
|---|---|---|---|
| Initial deposit | 10000.0 | ||
| Parameters | - | ||
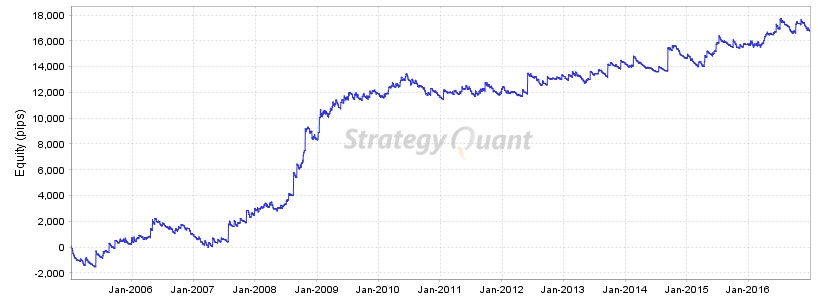
Total Profit
16808.8
pips
Profit in money
$ 16808.8
Yrly Avg profit
1401 pips
Yrly Avg % ret
14.01 %
CAGR
8.56 %
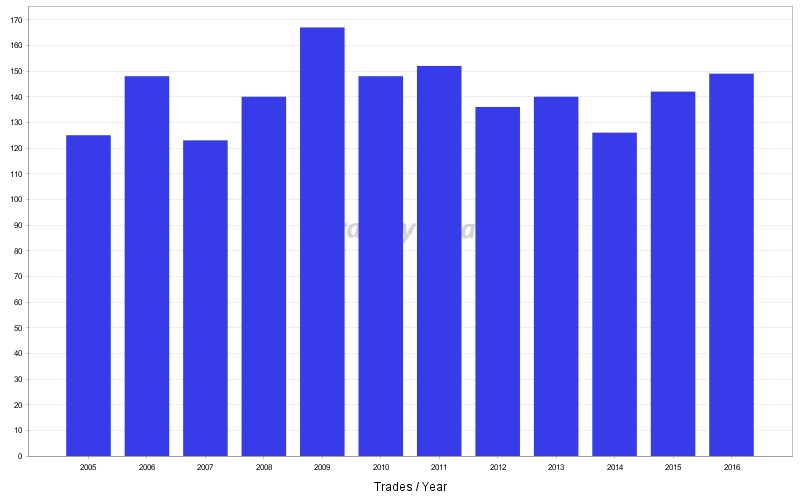
# of trades
1696
Sharpe ratio
0.07
Profit factor
1.26
Return / DD ratio
7.46
Winning %
35.05 %
Drawdown
2252.5 pips
% Drawdown
18.46 %
Daily Avg profit
4.71 pips
Mthly Avg profit
116.73 pips
Average trade
85.56 pips
Monthly Performance (pips)
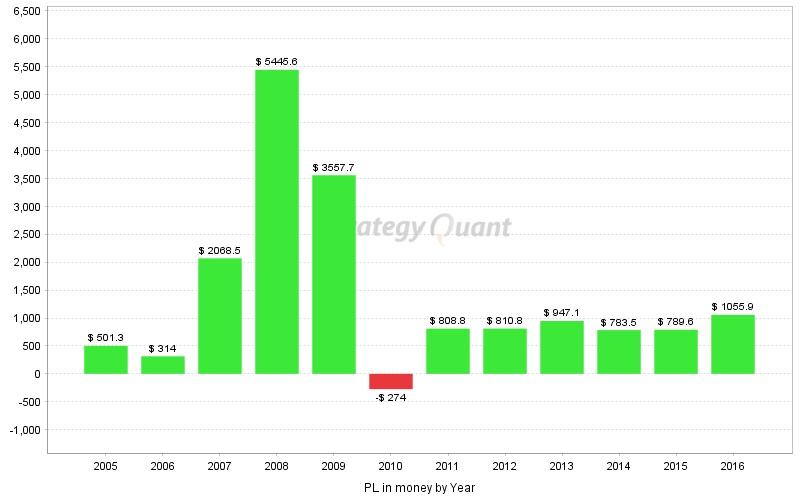
| Year | Jan | Feb | Mar | Apr | May | Jun | Jul | Aug | Sep | Oct | Nov | Dec | YTD |
| 2016 | -234.1 | 198.7 | 389.7 | 528.3 | 103.2 | 269.4 | 438.6 | -585.6 | 151.1 | 708.1 | -516.5 | -395 | 1055.9 |
| 2015 | -386.3 | -558.1 | 105.3 | 1064.2 | -89.2 | 1051.1 | -160.8 | -271.7 | 348 | -571.5 | 198.3 | 60.3 | 789.6 |
| 2014 | 15 | 376.1 | -268.9 | -338.5 | -79.8 | 116.6 | 1714.5 | -215.9 | 28.6 | -0.4 | -669.1 | 105.3 | 783.5 |
| 2013 | 90.7 | 224.4 | -247.6 | -190 | -110 | 517.5 | 245.3 | 212.7 | 339.2 | -118.5 | 360.8 | -377.4 | 947.1 |
| 2012 | -211.2 | -163.9 | 22 | 148.2 | 1258.9 | -260.2 | -183.6 | 89.9 | 60.6 | -103.8 | 242.6 | -88.7 | 810.8 |
| 2011 | 486.3 | 72.7 | -39.4 | 186.8 | 189.3 | -395.1 | -62.7 | 268 | 431.4 | -263 | -517.6 | 452.1 | 808.8 |
| 2010 | -10.6 | 242.2 | 349.8 | 19.7 | 529.4 | -92.6 | 21.9 | -445.3 | -389.6 | 152.5 | -132.9 | -518.5 | -274 |
| 2009 | 1956.5 | 102.1 | 899.6 | -124.6 | 257.3 | 98.7 | 63.2 | 113.5 | 107.4 | -108.2 | 506.7 | -314.5 | 3557.7 |
| 2008 | 305.9 | 74.5 | 215.7 | -505 | 92.8 | 582.6 | 360.8 | 2439.5 | 56.6 | 2667.4 | -624.5 | -220.7 | 5445.6 |
| 2007 | -98.8 | -239.7 | -145 | 238.2 | -150 | 1541.4 | 49.5 | -114.9 | 311.6 | 760 | -626.5 | 542.7 | 2068.5 |
| 2006 | 279.2 | 2.5 | -17.1 | 1373 | -199.6 | -86.8 | -359.5 | -231.8 | 320 | 107.1 | -238.4 | -634.6 | 314 |
| 2005 | -877.6 | -23.8 | 50.3 | -477.5 | 1045.5 | -508.6 | 513.9 | 318.5 | 403.6 | 88.1 | -132.1 | 101 | 501.3 |
Stats
Strategy
| Wins/Losses Ratio | 0.54 | Payout Ratio (Avg Win/Loss) | 2.34 | Average # of Bars in Trade | 0 |
| AHPR | 0.06 | Z-Score | -1.58 | Z-Probability | 94.29 % |
| Expectancy | 9.91 | Deviation | 153.19 pips | Exposure | -999999999 % |
| Stagnation in Days | 702 | Stagnation in % | 16.03 % |
Trades
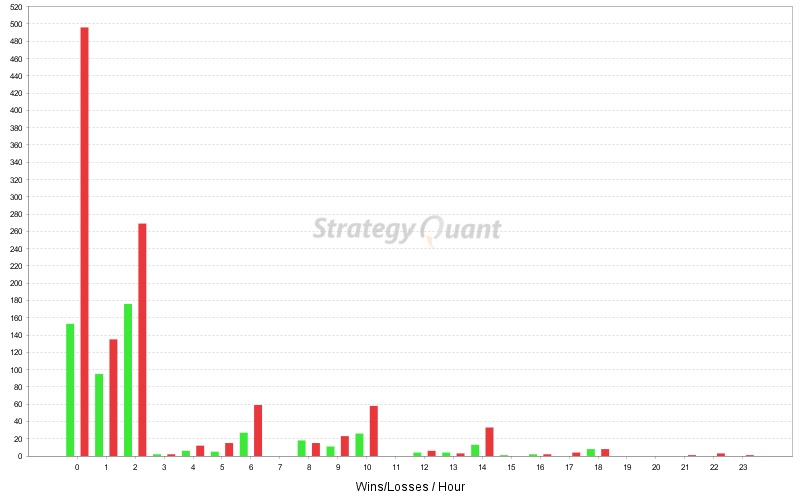
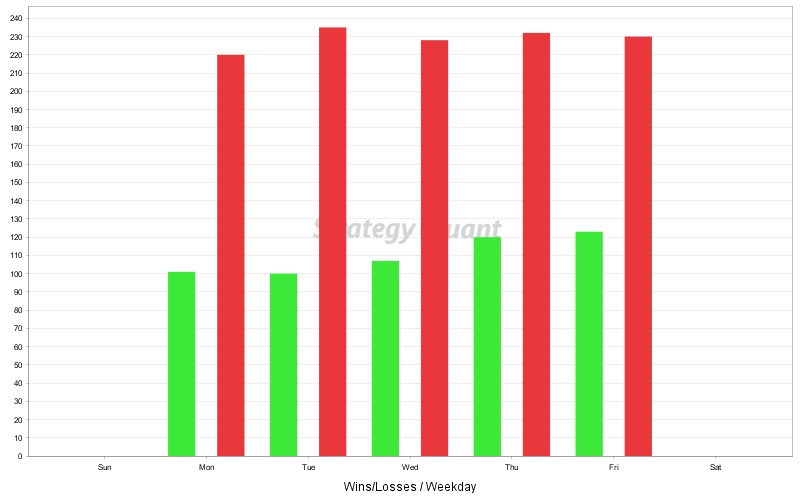
| # of Wins | 551 | # of Losses | 1021 | # of Cancelled/Expired | 124 | ||
| Gross Profit | 80958.8 pips | Gross Loss | -64150 pips | Average Win | 146.93 pips | Average Loss | -62.83 pips |
| Largest Win | 1067.1 pips | Largest Loss | -427.2 pips | Max Consec Wins | 6 | Max Consec Losses | 16 |
| Avg Consec Wins | 1.58 | Avg Consec Loss | 3.3 | Avg # of Bars in Wins | 0 | Avg # of Bars in Losses | 0 |
Charts
Click on the chart to see bigger image
