Quant Analyzer Report
StrategyTester_Angely_Pro_GBPJPY3_20050101-20161231
Source: MT4Report| Symbol | GBPJPY | Period | D1 : 05.01.2005 - 30.12.2016 |
|---|---|---|---|
| Initial deposit | 10000.0 | ||
| Parameters | - | ||
Total Profit
42698.4
pips
Profit in money
$ 38674.84
Yrly Avg profit
3556.48 pips
Yrly Avg % ret
32.21 %
CAGR
14.1 %
# of trades
1324
Sharpe ratio
0.11
Profit factor
1.62
Return / DD ratio
18.65
Winning %
27.45 %
Drawdown
2289.34 pips
% Drawdown
21.22 %
Daily Avg profit
11.54 pips
Mthly Avg profit
296.52 pips
Average trade
135.95 pips

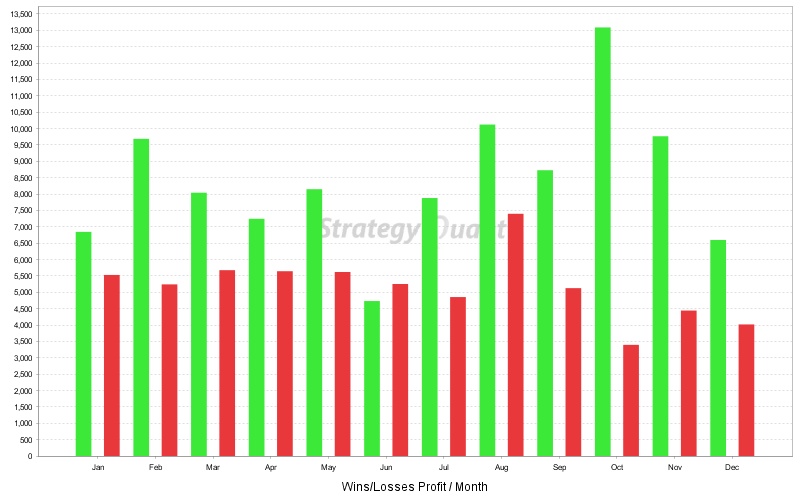
Monthly Performance (pips)
| Year | Jan | Feb | Mar | Apr | May | Jun | Jul | Aug | Sep | Oct | Nov | Dec | YTD |
| 2016 | 151.2 | 437.1 | -59.2 | 722.8 | -251.8 | -319.5 | 1032.3 | 833.7 | 1558.9 | -118.9 | 1183.3 | -46.5 | 5123.4 |
| 2015 | -336.1 | -169.8 | -110.9 | 729.3 | 24.4 | 734.7 | -156.9 | 127.7 | -133 | 162.7 | -265.9 | 2053.9 | 2660.1 |
| 2014 | -595.3 | 159.7 | 58.7 | -331.8 | -2.4 | 84.4 | -137.9 | -438.4 | 860.5 | 2629.6 | -267 | 820.7 | 2840.8 |
| 2013 | 40 | 644.3 | -550.9 | -181.3 | -225.5 | 18.2 | 162.5 | 27.6 | -406 | -438.1 | 510.9 | -250.8 | -649.1 |
| 2012 | 280.4 | 966.4 | -428.8 | 675.2 | 536.9 | -252.2 | -194.9 | -56.6 | 172.3 | -173.8 | 2073.9 | -232.7 | 3366.1 |
| 2011 | 328.1 | -106.1 | 509.8 | 60.9 | 342.3 | -21.5 | -126.8 | 1100.2 | -282.2 | 855.3 | 317 | -426.9 | 2550.1 |
| 2010 | 303.2 | 1817.2 | 1471.2 | -479.5 | 1279.1 | -448.7 | -334.4 | 42.8 | 30.5 | 535 | -235.1 | 91.5 | 4072.8 |
| 2009 | -205 | -93 | 2973.6 | 134.4 | 761.3 | -830.8 | 2031.3 | -599.9 | 842.5 | 1025.8 | 395.4 | 426.2 | 6861.8 |
| 2008 | 567.6 | 286.3 | -1036.8 | 901.7 | 489 | 292.6 | 255.5 | 2927 | 730.1 | 4531.8 | -81.1 | -211.1 | 9652.6 |
| 2007 | -295.2 | 1109.4 | -250.7 | 647.4 | -142.1 | 624.6 | 921.9 | -1966 | -310.2 | 694.2 | 1877.1 | 983.7 | 3894.1 |
| 2006 | 833.2 | 0 | 274 | -607.8 | 588.2 | -556.9 | 309.3 | 1094.2 | 916.8 | 716.5 | -152.8 | -99.5 | 3315.2 |
| 2005 | 379.3 | -146 | -238.6 | -504.7 | -608.6 | 99.9 | -422 | -82.2 | -4.5 | 279.2 | 518.6 | -259.9 | -989.5 |
Stats
Strategy
| Wins/Losses Ratio | 0.38 | Payout Ratio (Avg Win/Loss) | 4.29 | Average # of Bars in Trade | 0 |
| AHPR | 0.13 | Z-Score | -6.71 | Z-Probability | 0 % |
| Expectancy | 32.25 | Deviation | 262.09 pips | Exposure | -999999999 % |
| Stagnation in Days | 596 | Stagnation in % | 13.62 % |
Trades
| # of Wins | 339 | # of Losses | 896 | # of Cancelled/Expired | 89 | ||
| Gross Profit | 111347.3 pips | Gross Loss | -68648.9 pips | Average Win | 328.46 pips | Average Loss | -76.62 pips |
| Largest Win | 1591.4 pips | Largest Loss | -521.6 pips | Max Consec Wins | 7 | Max Consec Losses | 22 |
| Avg Consec Wins | 1.67 | Avg Consec Loss | 4.85 | Avg # of Bars in Wins | 0 | Avg # of Bars in Losses | 0 |
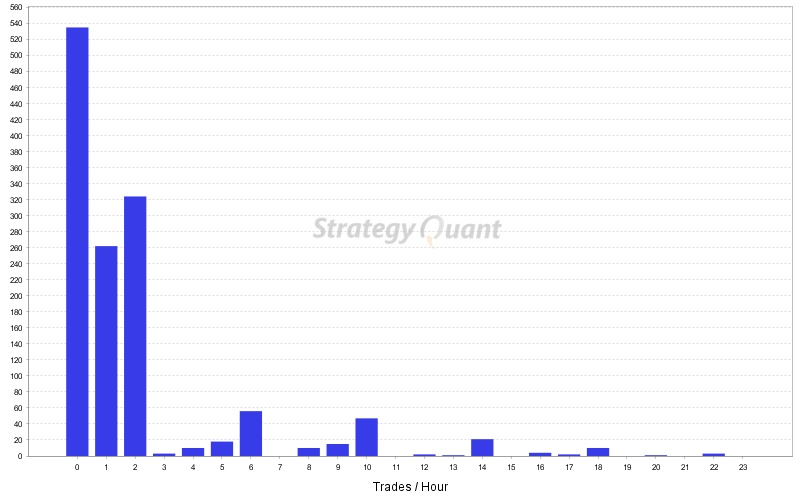
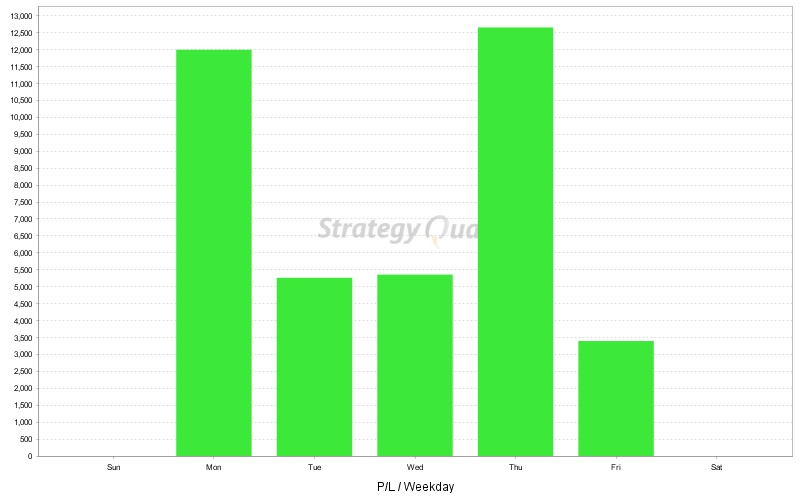
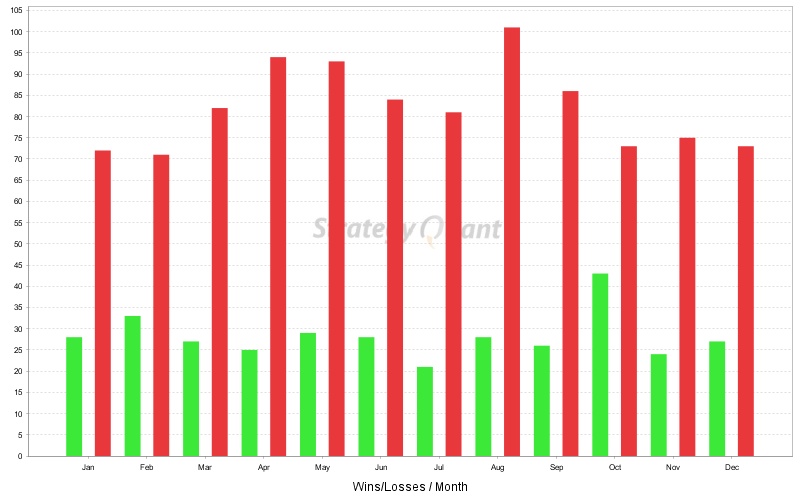
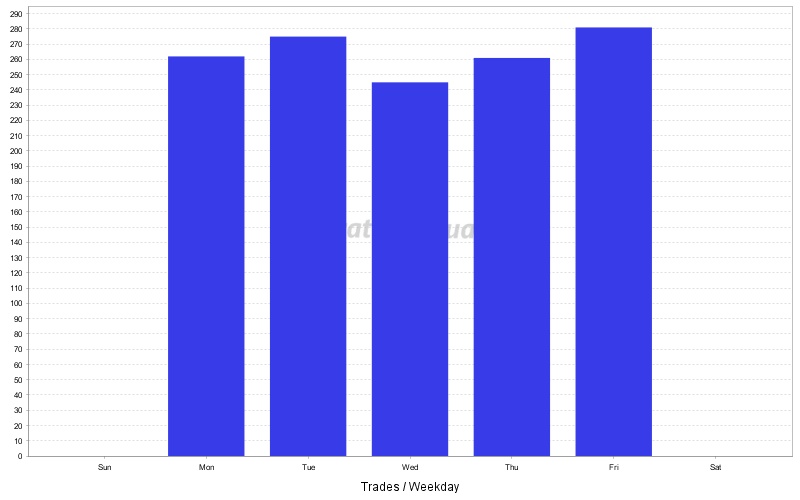
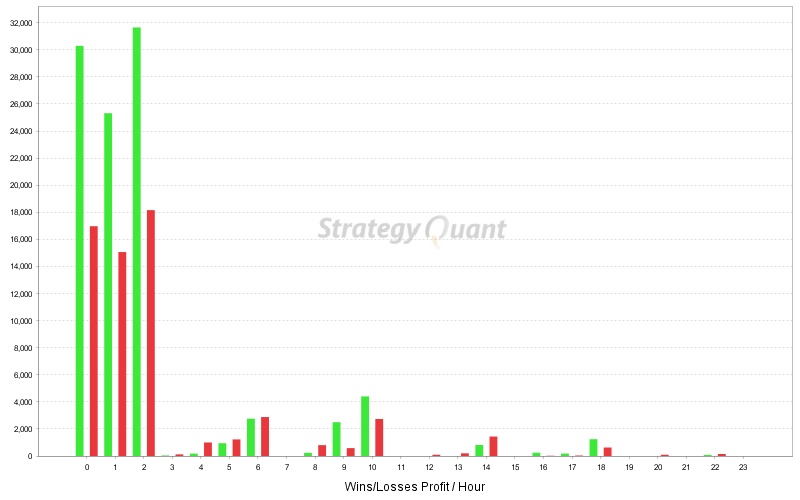
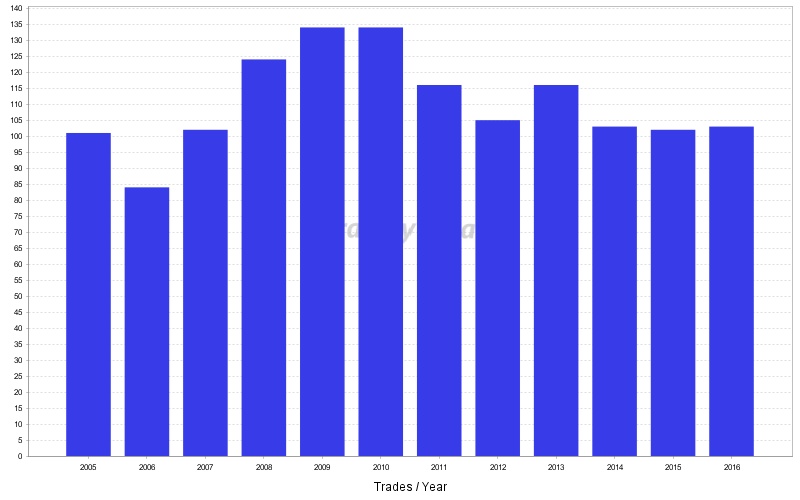
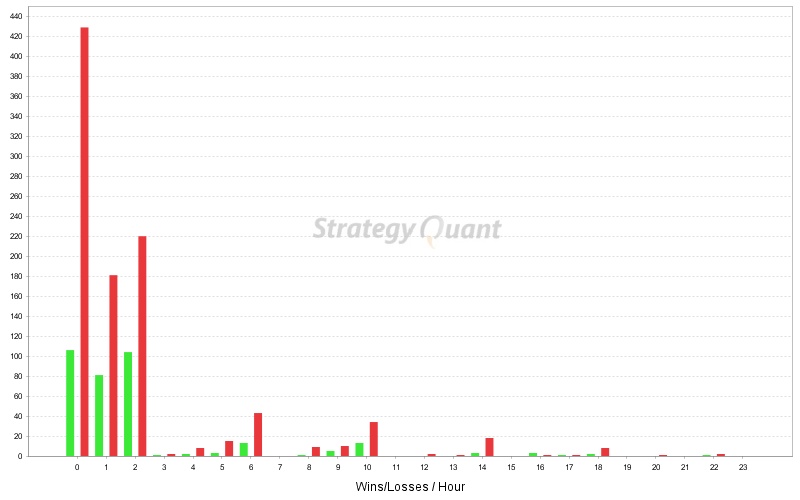
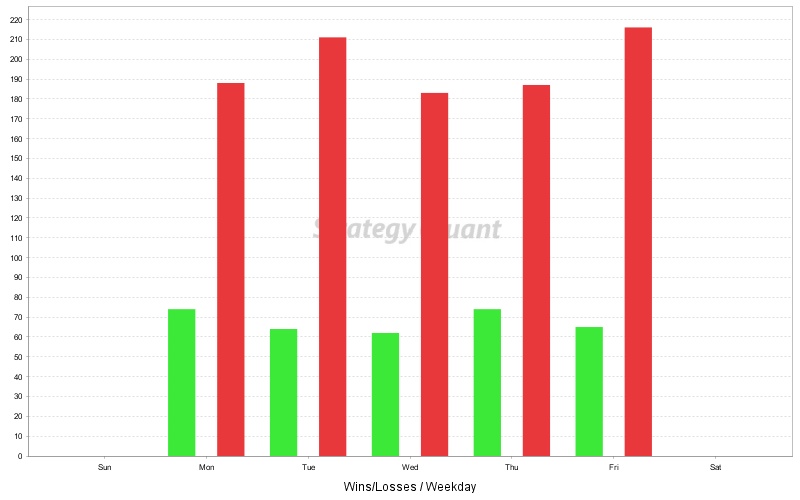
Charts
Click on the chart to see bigger image