Quant Analyzer Portfolio Report
Portfolio_ASTI by Trilogy Inc.
Total Profit
$ 191439.91
Profit in pips
209312.3 pips
Yrly Avg profit
$ 15953.64
Yrly Avg % ret
15.95 %
CAGR
9.32 %
# of trades
28582
Sharpe ratio
0
Profit factor
1.17
Return / DD ratio
10.29
Winning %
44.75 %
Drawdown
$ 18598.48
% Drawdown
8.39 %
Daily Avg profit
$ 43.7
Mthly Avg profit
$ 1329.44
Average trade
$ 83.62
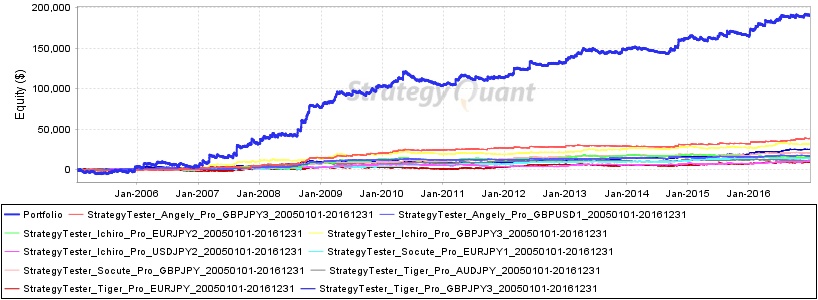
Strategies in portfolio
| # | Name | Symbol | Timeframe | Net Profit ($) | Net Profit (pips) | # of Trades | Sharpe Ratio | Profit Factor |
| S1 | StrategyTester_Angely_Pro_GBPJPY3_20050101-20161231 | StrategyTester_Angely_Pro_GBPJPY3_20050101-20161231 | unknown | $ 38674.84 | 42698.4 pips | 1324 | 0.11 | 1.62 |
| S2 | StrategyTester_Angely_Pro_GBPUSD1_20050101-20161231 | StrategyTester_Angely_Pro_GBPUSD1_20050101-20161231 | unknown | $ 16808.8 | 16808.8 pips | 1696 | 0.07 | 1.26 |
| S3 | StrategyTester_Ichiro_Pro_EURJPY2_20050101-20161231 | StrategyTester_Ichiro_Pro_EURJPY2_20050101-20161231 | unknown | $ 15431.59 | 17037.2 pips | 7095 | 0.02 | 1.07 |
| S4 | StrategyTester_Ichiro_Pro_GBPJPY3_20050101-20161231 | StrategyTester_Ichiro_Pro_GBPJPY3_20050101-20161231 | unknown | $ 31625.89 | 34915.1 pips | 4073 | 0.05 | 1.13 |
| S5 | StrategyTester_Ichiro_Pro_USDJPY2_20050101-20161231 | StrategyTester_Ichiro_Pro_USDJPY2_20050101-20161231 | unknown | $ 10327.7 | 11102 pips | 6376 | 0.02 | 1.08 |
| S6 | StrategyTester_Socute_Pro_EURJPY1_20050101-20161231 | StrategyTester_Socute_Pro_EURJPY1_20050101-20161231 | unknown | $ 13279.02 | 14661.9 pips | 1160 | 0.08 | 1.25 |
| S7 | StrategyTester_Socute_Pro_GBPJPY_20050101-20161231 | StrategyTester_Socute_Pro_GBPJPY_20050101-20161231 | unknown | $ 20402.16 | 22528.2 pips | 1027 | 0.07 | 1.29 |
| S8 | StrategyTester_Tiger_Pro_AUDJPY_20050101-20161231 | StrategyTester_Tiger_Pro_AUDJPY_20050101-20161231 | unknown | $ 11427.44 | 12615.9 pips | 1071 | 0.07 | 1.16 |
| S9 | StrategyTester_Tiger_Pro_EURJPY_20050101-20161231 | StrategyTester_Tiger_Pro_EURJPY_20050101-20161231 | unknown | $ 8636.18 | 9535.4 pips | 2371 | 0.04 | 1.09 |
| S10 | StrategyTester_Tiger_Pro_GBPJPY3_20050101-20161231 | StrategyTester_Tiger_Pro_GBPJPY3_20050101-20161231 | unknown | $ 24826.29 | 27409.4 pips | 2389 | 0.08 | 1.25 |
| # | Name | Return / DD Ratio | Winning % | Drawdown | % Drawdown | Yearly avg. profit | Monthly avg. profit | Daily avg. profit |
| S1 | StrategyTester_Angely_Pro_GBPJPY3_20050101-20161231 | 16.89 | 27.45 % | $ 2289.34 | 21.22 % | $ 3221.35 | $ 268.58 | $ 10.46 |
| S2 | StrategyTester_Angely_Pro_GBPUSD1_20050101-20161231 | 7.46 | 35.05 % | $ 2252.5 | 18.46 % | $ 1401 | $ 116.73 | $ 4.71 |
| S3 | StrategyTester_Ichiro_Pro_EURJPY2_20050101-20161231 | 3.52 | 45.51 % | $ 4383.94 | 17.82 % | $ 1285.94 | $ 107.16 | $ 3.55 |
| S4 | StrategyTester_Ichiro_Pro_GBPJPY3_20050101-20161231 | 7.34 | 47.41 % | $ 4306.67 | 23.45 % | $ 2635.05 | $ 219.62 | $ 7.23 |
| S5 | StrategyTester_Ichiro_Pro_USDJPY2_20050101-20161231 | 2.65 | 42.35 % | $ 3897.4 | 22.43 % | $ 860.68 | $ 71.72 | $ 2.36 |
| S6 | StrategyTester_Socute_Pro_EURJPY1_20050101-20161231 | 7.66 | 40.93 % | $ 1734.02 | 12.82 % | $ 1107.2 | $ 92.22 | $ 3.65 |
| S7 | StrategyTester_Socute_Pro_GBPJPY_20050101-20161231 | 8.84 | 35.76 % | $ 2307.29 | 19.35 % | $ 1699.72 | $ 141.68 | $ 5.61 |
| S8 | StrategyTester_Tiger_Pro_AUDJPY_20050101-20161231 | 4.33 | 49.86 % | $ 2639.11 | 14.35 % | $ 952.61 | $ 79.36 | $ 2.64 |
| S9 | StrategyTester_Tiger_Pro_EURJPY_20050101-20161231 | 3.14 | 57.82 % | $ 2747.71 | 25.42 % | $ 719.89 | $ 59.97 | $ 2.09 |
| S10 | StrategyTester_Tiger_Pro_GBPJPY3_20050101-20161231 | 9.33 | 47.65 % | $ 2661.87 | 18.4 % | $ 2068.82 | $ 172.4 | $ 6.25 |
Monthly Performance ($)
| Year | Jan | Feb | Mar | Apr | May | Jun | Jul | Aug | Sep | Oct | Nov | Dec | YTD |
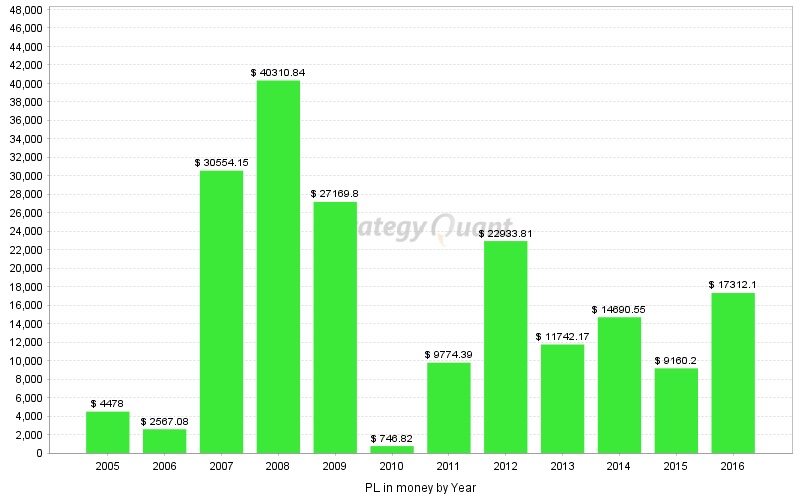
| 2016 | -576.76 | 7527.07 | -629.04 | 5052.57 | -1501.29 | 1682.45 | 4050.47 | 2219.07 | -1697.41 | -163.36 | 3051.09 | -1702.76 | 17312.1 |
| 2015 | -479.29 | -2691.4 | -745.03 | 2507.12 | -77.35 | 3423.87 | -549.93 | 3357.75 | 906.77 | -1562.29 | -654.63 | 5724.61 | 9160.2 |
| 2014 | 1009.39 | -1493.62 | 839.32 | -2228.66 | -724.39 | -1373.8 | 1583.82 | -1917.87 | 5020.96 | 10815.08 | 984.86 | 2175.46 | 14690.55 |
| 2013 | 1986.21 | 1462.61 | 2020.6 | 4291.94 | -357.32 | 68.32 | -1922.52 | -407.79 | -420.96 | -400.68 | 4882.19 | 539.57 | 11742.17 |
| 2012 | 3634.26 | 5580.57 | 585.91 | 2617.67 | 5108.33 | -1989.85 | -474.21 | -608.05 | 1899.77 | -684.99 | 4851.51 | 2412.89 | 22933.81 |
| 2011 | 1297.93 | -1239.94 | 8962.64 | 1404.45 | -1249.64 | -3180.45 | 1693.33 | 132.56 | -444.85 | 1904.32 | 97.42 | 396.62 | 9774.39 |
| 2010 | -1928.81 | 4582.81 | 5431.35 | 1302.34 | 3884 | -2736.28 | -4341.35 | 877.16 | -2222.85 | -2075.34 | -1738.07 | -288.14 | 746.82 |
| 2009 | 3862.12 | 2428.24 | 8880.87 | 3394.91 | -2399.89 | -2203.12 | 5142.33 | -2162.07 | 137.23 | 5711.43 | 1476.24 | 2901.51 | 27169.8 |
| 2008 | 2757.12 | 2679.88 | -1685.98 | 2619.35 | 990.15 | -1312.97 | 1669.26 | 13894.94 | 2216.08 | 18153.33 | -954.01 | -716.31 | 40310.84 |
| 2007 | 2805.55 | 7119.99 | 1381.7 | -275.99 | -2357.56 | 3328.78 | 2607.78 | 7640.11 | 1668.29 | 3382.73 | -1040.61 | 4293.38 | 30554.15 |
| 2006 | 2822.18 | 1295.87 | 178.31 | 902.53 | 83.63 | -1450.52 | -756.79 | 328.96 | 294.65 | -135.33 | -1019.96 | 23.55 | 2567.08 |
| 2005 | 686.87 | -951.39 | -1033.1 | -1677 | 129.28 | -88.88 | 1790.52 | 2128.18 | -1984.22 | 964.23 | 1382.05 | 3131.46 | 4478 |
Stats
Strategy
| Wins/Losses Ratio | 0.81 | Payout Ratio (Avg Win/Loss) | 1.45 | Average # of Bars in Trade | 0 |
| AHPR | 0 | Z-Score | -55.32 | Z-Probability | 99.9 % |
| Expectancy | 6.7 | Deviation | $ 149.14 | Exposure | -999999999 % |
| Stagnation in Days | 644 | Stagnation in % | 14.7 % |
Trades
| # of Wins | 11427 | # of Losses | 14110 | # of Cancelled/Expired | 3045 | ||
| Gross Profit | $ 1290748.67 | Gross Loss | $ -1099308.76 | Average Win | $ 112.96 | Average Loss | $ -77.91 |
| Largest Win | $ 1474.55 | Largest Loss | $ -720.53 | Max Consec Wins | 25 | Max Consec Losses | 37 |
| Avg Consec Wins | 2.71 | Avg Consec Loss | 4.07 | Avg # of Bars in Wins | 0 | Avg # of Bars in Losses | 0 |
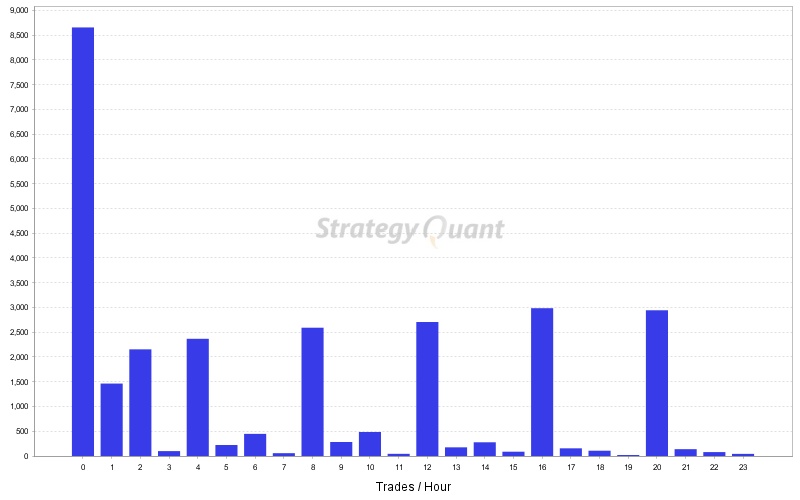
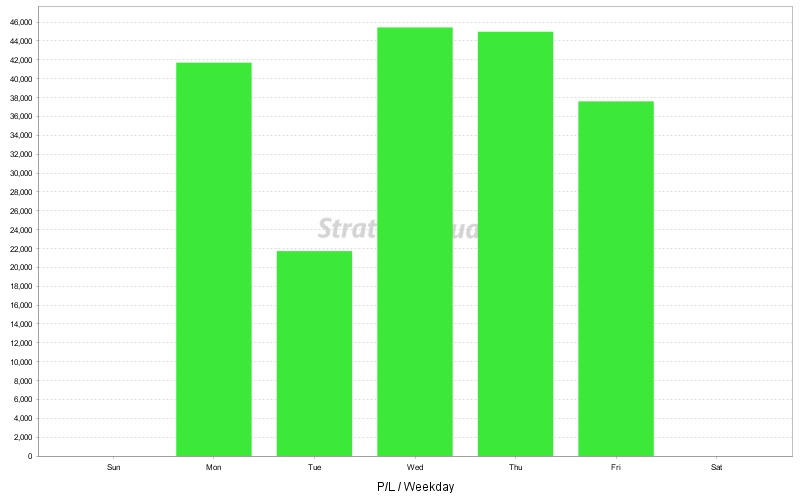
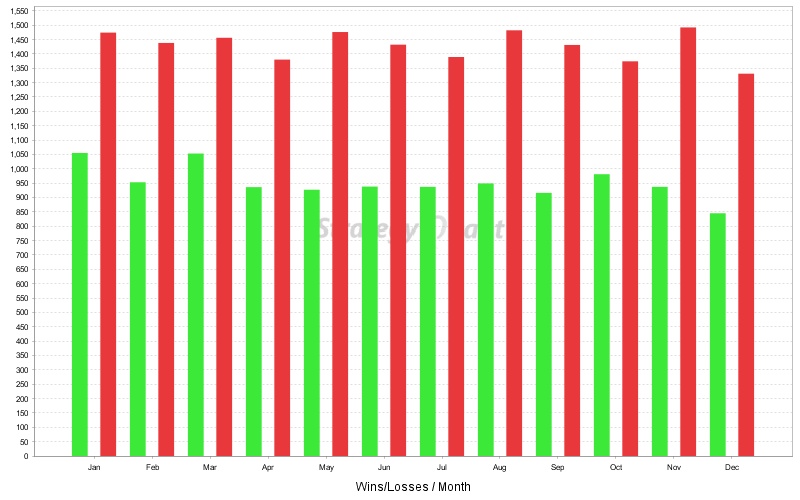
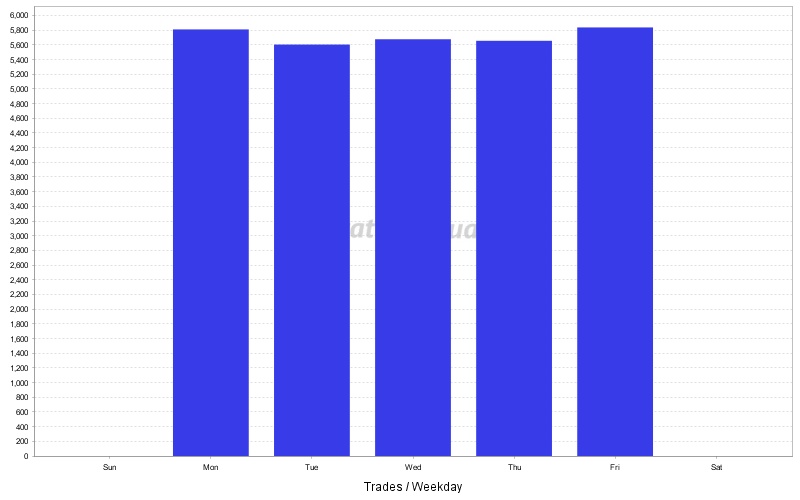
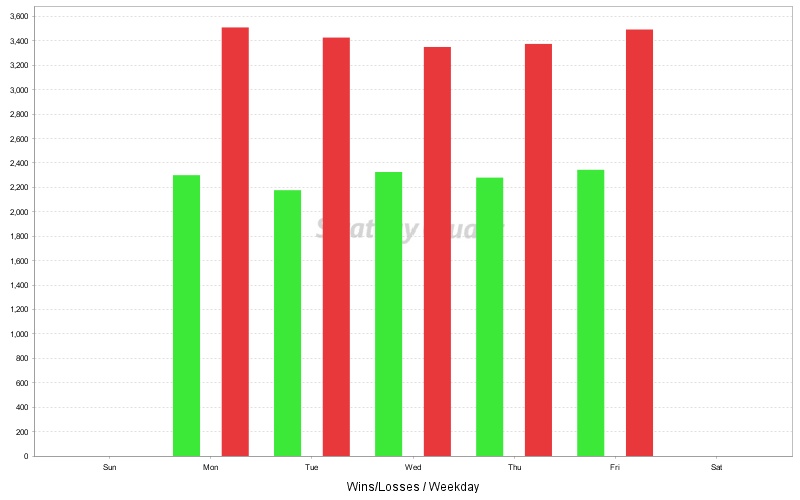
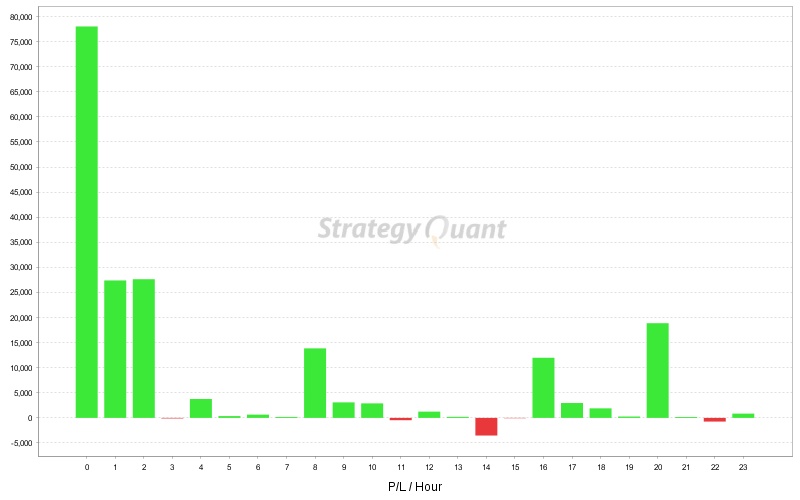
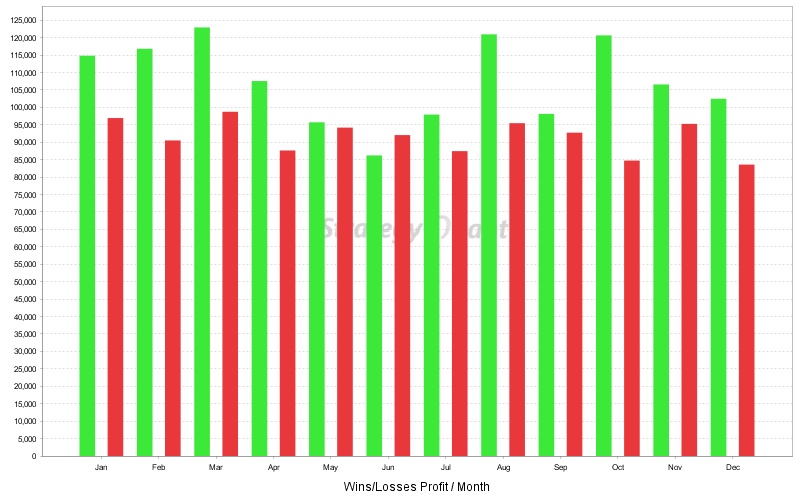
Charts
Click on the chart to see bigger image