Quant Analyzer Portfolio Report
Portfolio
Total Profit
$ 68480.68
Profit in pips
79073.2 pips
Yrly Avg profit
$ 5706.95
Yrly Avg % ret
28.53 %
CAGR
13.19 %
# of trades
4088
Sharpe ratio
0.1
Profit factor
1.4
Return / DD ratio
23.63
Winning %
44.5 %
Drawdown
$ 2898.39
% Drawdown
9.84 %
Daily Avg profit
$ 16.02
Mthly Avg profit
$ 475.56
Average trade
$ 101.09
Annual% / Max DD%
1.34
R Expectancy
0.2 R
R Exp score
67.14 R
SQN
6.77
SQN score
3.06

Strategies in portfolio
| # | Name | Symbol | Timeframe | Net Profit ($) | Net Profit (pips) | # of Trades | Sharpe Ratio | Profit Factor |
| S1 | StrategyTester_Angely for Abe deposit | StrategyTester_Angely for Abe deposit | unknown | $ 38142 | 43864 pips | 1343 | 0.11 | 1.68 |
| S2 | StrategyTester_Tiger for Abe deposit | StrategyTester_Tiger for Abe deposit | unknown | $ 30338.68 | 35209.2 pips | 2745 | 0.07 | 1.26 |
| # | Name | Return / DD Ratio | Winning % | Drawdown | % Drawdown | Yearly avg. profit | Monthly avg. profit | Daily avg. profit |
| S1 | StrategyTester_Angely for Abe deposit | 18.11 | 26.21 % | $ 2106.35 | 17.15 % | $ 3179.73 | $ 264.88 | $ 10.4 |
| S2 | StrategyTester_Tiger for Abe deposit | 9.84 | 53.89 % | $ 3082.15 | 20.46 % | $ 2527.89 | $ 210.69 | $ 7.54 |
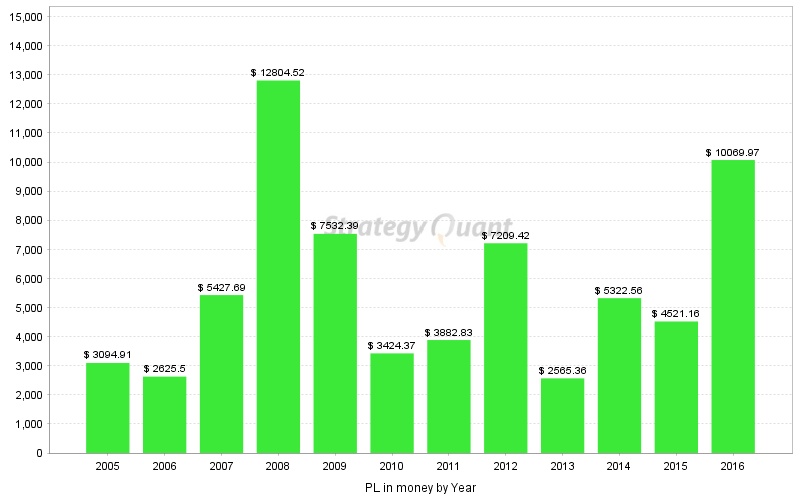
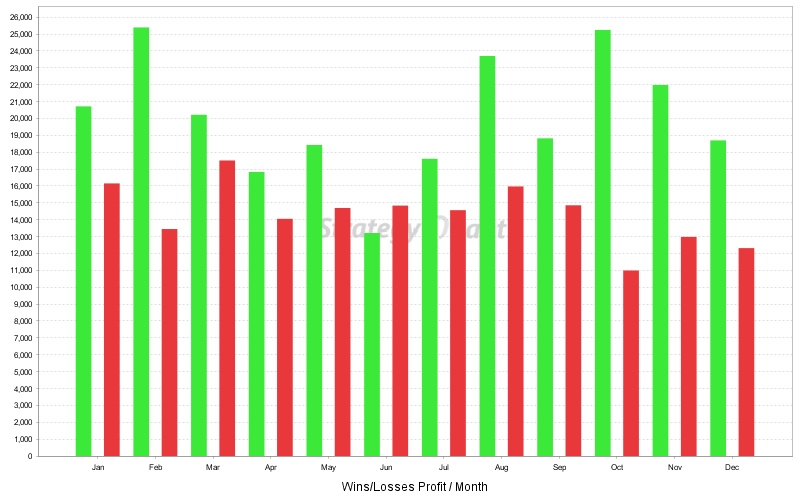
Monthly Performance ($)
| Year | Jan | Feb | Mar | Apr | May | Jun | Jul | Aug | Sep | Oct | Nov | Dec | YTD |
| 2016 | 1190.6 | 1978.81 | -732.43 | 1195.56 | -727.11 | -221.28 | 1964.25 | 2219.33 | 1707.16 | -271.49 | 1811.32 | -44.75 | 10069.97 |
| 2015 | -717.63 | -168.73 | 347.95 | 523.97 | -19.25 | 748.17 | 502.97 | 609.61 | -555.95 | -13.57 | -272.52 | 3536.14 | 4521.16 |
| 2014 | -580.56 | 421.21 | 102.45 | -582.09 | -302.61 | -127.14 | -637.98 | -539.61 | 1404.08 | 5110.68 | 209.77 | 844.36 | 5322.56 |
| 2013 | -446.07 | 1559.39 | 857.66 | -358.98 | -560 | -810.89 | 357.22 | -162.31 | -26.03 | 53.01 | 2607.5 | -505.14 | 2565.36 |
| 2012 | 517.9 | 2584.36 | -684.38 | 395.88 | 2414.76 | -313.36 | -504.19 | 94.86 | 361.51 | -572.83 | 2442.74 | 472.17 | 7209.42 |
| 2011 | -33.18 | 53.12 | 581.07 | 174.48 | 234.09 | -194.91 | 506.99 | 510.95 | 609.41 | 1783.68 | 229.99 | -572.86 | 3882.83 |
| 2010 | -960.48 | 3467.5 | 1554.05 | -970.52 | 1622.65 | -1133.33 | -383.85 | 263.24 | -846.5 | 585.2 | -311.83 | 538.24 | 3424.37 |
| 2009 | -532.91 | 966.9 | 2407.14 | 137.23 | 613.53 | -113.47 | 1379.91 | 87.45 | 314.13 | 1384.7 | 28.27 | 859.51 | 7532.39 |
| 2008 | 2357.47 | 295.54 | -961.75 | 1436.67 | 614.03 | 593.76 | -660.55 | 4493.75 | 1584.87 | 4282.14 | -581.88 | -649.53 | 12804.52 |
| 2007 | 827.89 | 881.89 | 186.84 | 322.57 | -312.18 | 730.02 | 667.42 | -1505.18 | -681.49 | 1080.6 | 2439.33 | 789.98 | 5427.69 |
| 2006 | 1371.54 | 186.13 | -639.77 | 97.85 | 623.52 | -479.49 | -183.16 | 1117.52 | 360.89 | 96.26 | -187.68 | 261.89 | 2625.5 |
| 2005 | 1570.94 | -281.18 | -311.42 | 402 | -466.57 | -302.84 | 36.62 | 540.2 | -264.35 | 731.9 | 585.85 | 853.76 | 3094.91 |
Stats
Strategy
| Wins/Losses Ratio | 0.8 | Payout Ratio (Avg Win/Loss) | 1.74 | Average # of Bars in Trade | 0 |
| AHPR | 0.04 | Z-Score | -5.27 | Z-Probability | 100 % |
| Expectancy | 16.75 | Deviation | $ 179.23 | Exposure | -999999999 % |
| Stagnation in Days | 414 | Stagnation in % | 9.45 % |
Trades
| # of Wins | 1626 | # of Losses | 2028 | # of Cancelled/Expired | 434 | ||
| Gross Profit | $ 240859.98 | Gross Loss | $ -172379.3 | Average Win | $ 148.13 | Average Loss | $ -85 |
| Largest Win | $ 1352.63 | Largest Loss | $ -448.71 | Max Consec Wins | 8 | Max Consec Losses | 14 |
| Avg Consec Wins | 1.96 | Avg Consec Loss | 2.98 | Avg # of Bars in Wins | 0 | Avg # of Bars in Losses | 0 |
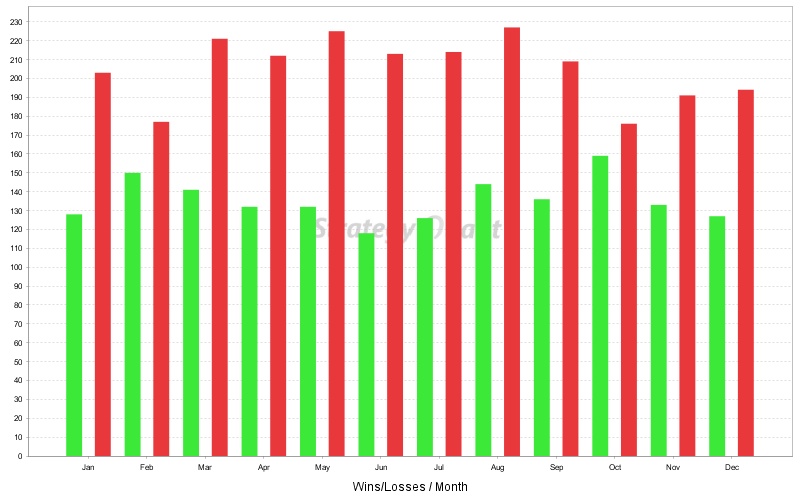
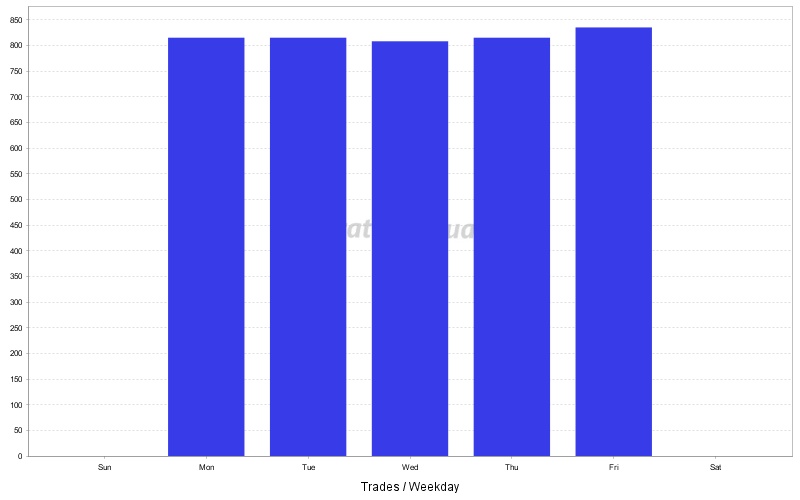
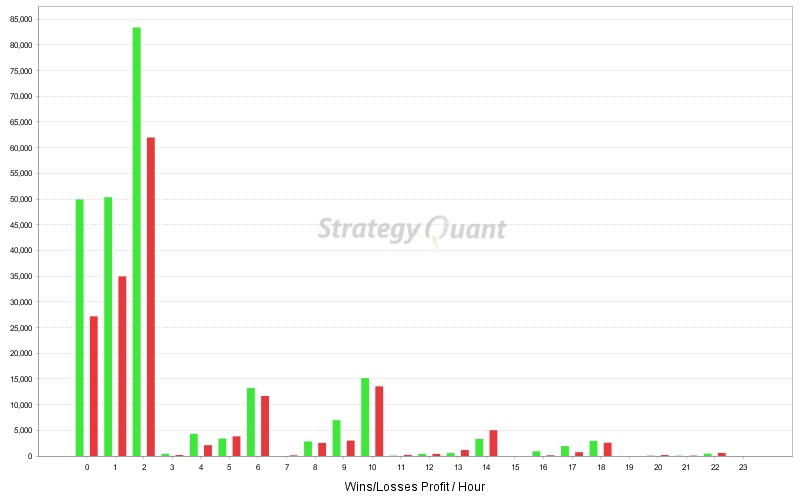
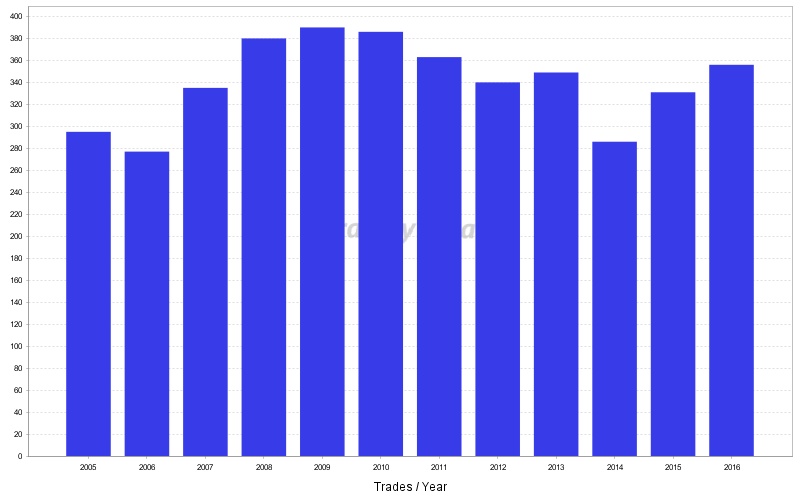
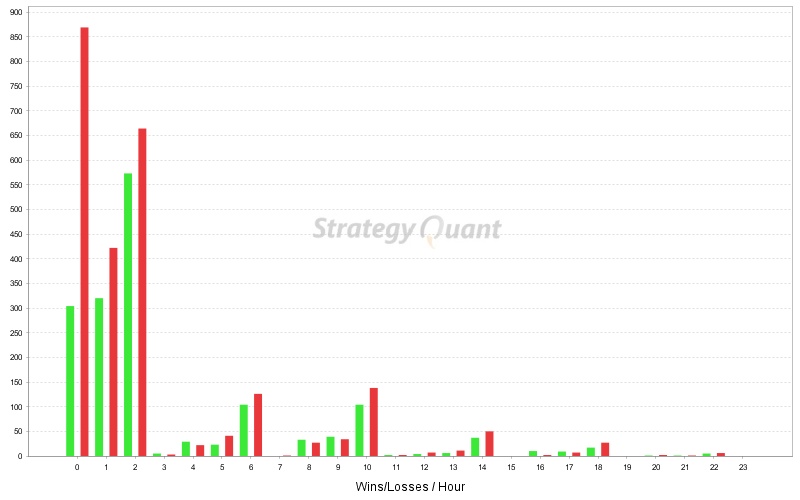
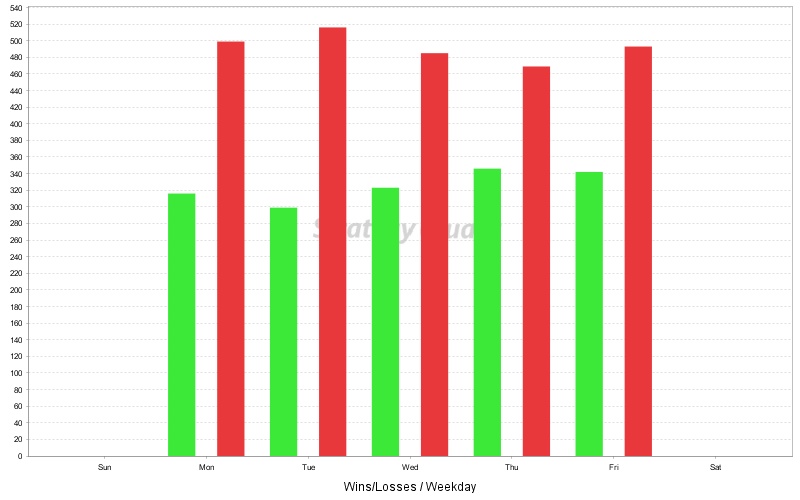
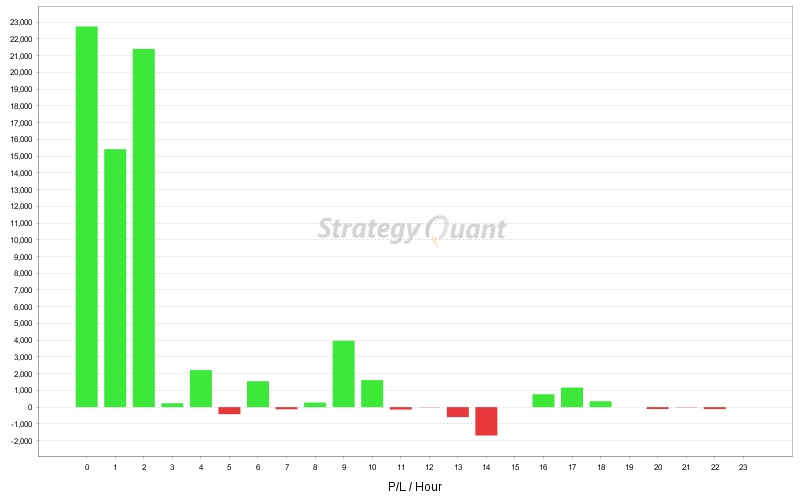
Charts
Click on the chart to see bigger image